
Neonatal Quality Improvement 2
Session: Neonatal Quality Improvement 2
 Credit")
Paulina Hume, MD
Fellow
University of California Davis Children's Hospital
612 El Dorado Way, California, United States
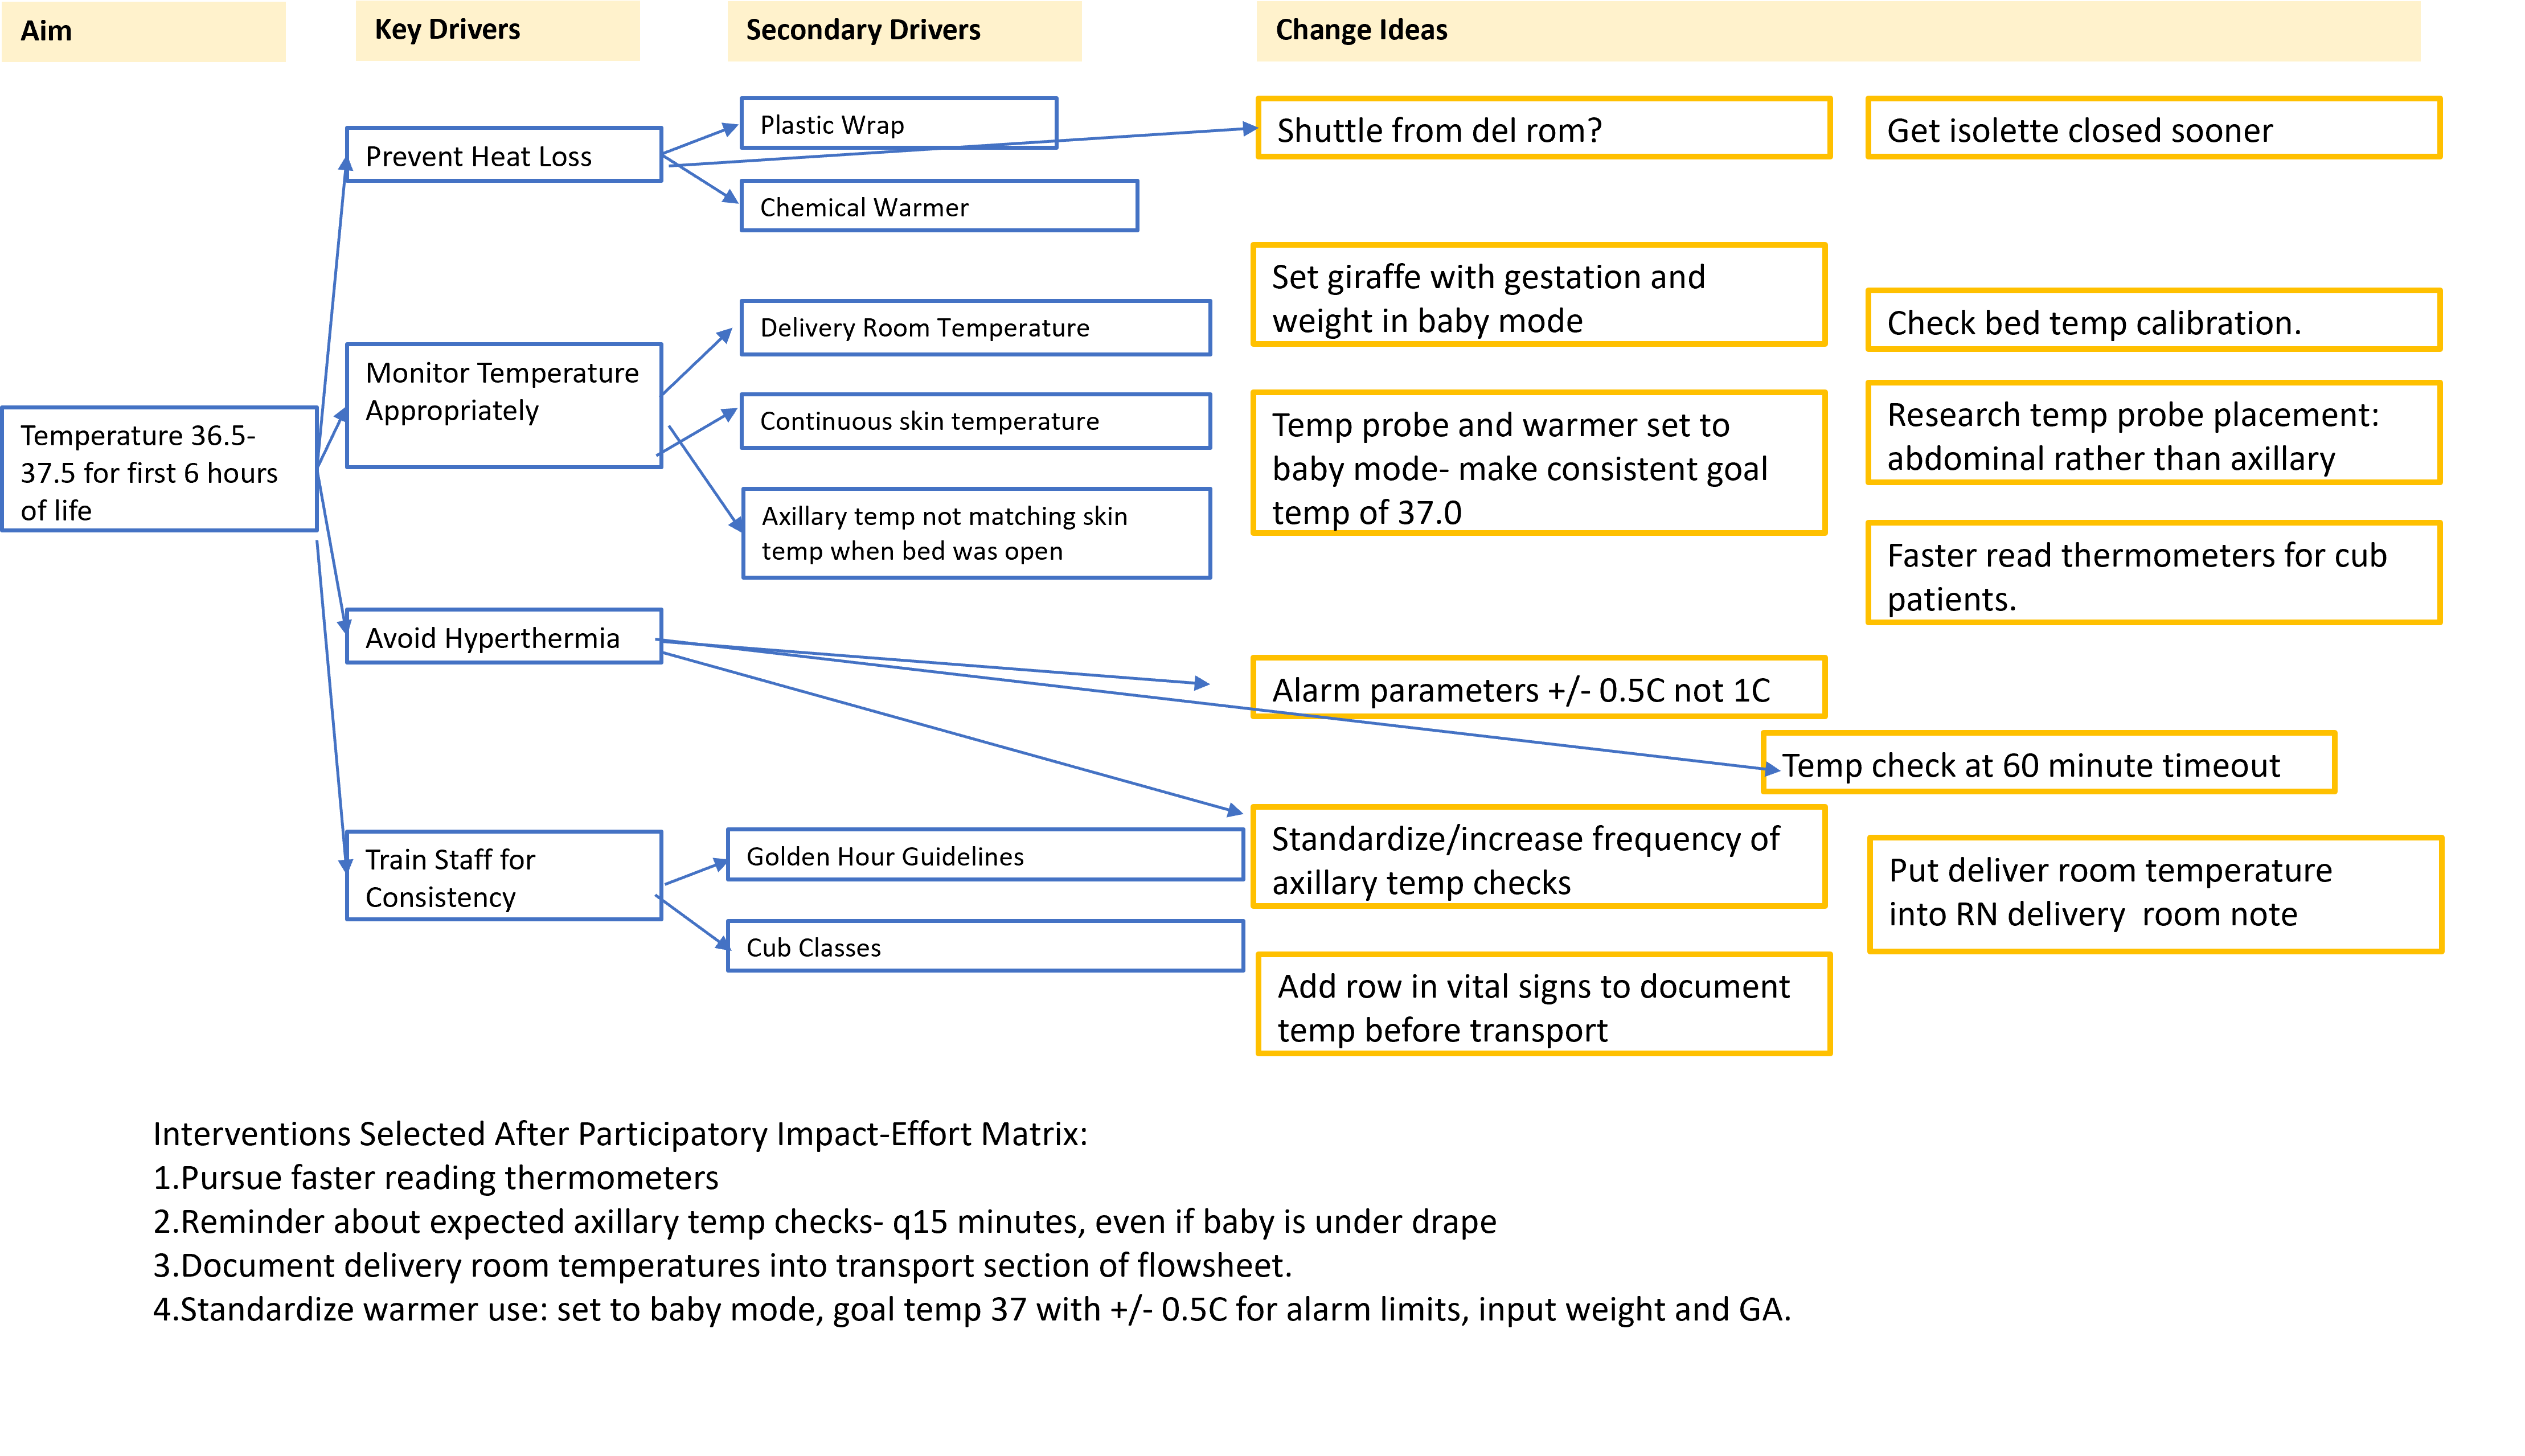 Introducing admission guidelines and specific RN training did not produce the sustained improvement in admission normothermia we were hoping for. To address this, a structured brainstorming session was held with the cub-trained nurses. We presented the framework of a key driver diagram (blue boxes) and added RN suggestions in the yellow boxes. These change ideas were then ranked on an impact-effort matrix and the high-impact low effort ideas noted on the bottom of the figure were introduced.
 .png) These groups are split by before and after the admission guidelines as we saw a change in the admission process then (Fig 2). *Statistically significant difference via t-test, p=0.004. **Statistically significant difference in pre- and post- groups via chi-square, p=0.009.
These groups are split by before and after the admission guidelines as we saw a change in the admission process then (Fig 2). *Statistically significant difference via t-test, p=0.004. **Statistically significant difference in pre- and post- groups via chi-square, p=0.009. .png) Run chart for lowest temperature in first 6h of life (top), with the episodes of hyperthermia noted as orange dots on the date of admission. We noted new hyperthermia when we began planning this project. The grey line represents the baseline median of 36.4 C. Significant shifts are demarcated with green boxes. Below is a control chart showing minutes from birth to both dextrose-containing IV fluid and surfactant among infants intubated in the delivery room. The baseline group (11/2022-07/2023) averaged 135 minutes, which improved to 87 minutes. This shift occurred after implementation of our admission guidelines.
Run chart for lowest temperature in first 6h of life (top), with the episodes of hyperthermia noted as orange dots on the date of admission. We noted new hyperthermia when we began planning this project. The grey line represents the baseline median of 36.4 C. Significant shifts are demarcated with green boxes. Below is a control chart showing minutes from birth to both dextrose-containing IV fluid and surfactant among infants intubated in the delivery room. The baseline group (11/2022-07/2023) averaged 135 minutes, which improved to 87 minutes. This shift occurred after implementation of our admission guidelines.