677 - Association between Medicaid Expansion and early childhood immunization rates using the National Immunization Survey-Child, 2012-2019.
Friday, April 25, 2025
5:30pm – 7:45pm HST
Publication Number: 677.3869
Christina L. Clarke, Kaiser Permanente Institute for Health Research, Aurora, CO, United States; Sophia R. Newcomer, University of Montana Center for Population Health Research, Missoula, MT, United States; Matthew Daley, Kaiser Permanente Colorado, Aurora, CO, United States; Alexandria N. Albers, University of Montana, Missoula, MT, United States; Sarah Y. Michels, University of Montana, Missoula, MT, United States; Jason Glanz, kaiser Permanente, Institute for Health Research, Aurora, CO, United States
Associate Professor University of Montana Center for Population Health Research Missoula, Montana, United States
Background: In 2014, Medicaid expanded coverage to include adults with incomes up to 138% of the federal poverty level. States have adopted Medicaid Expansion (ME) at various time points from 2014 to present. Parental enrollment in Medicaid is associated with a 29% increase in likelihood that children receive an annual well-child visit. However, the relationship between ME and childhood immunization rates is not known. Objective: To assess whether Medicaid expansion led to changes in vaccination coverage for children ages 0-24 months. Design/Methods: We used a difference-in-differences design to assess changes in state-specific childhood immunization rates pre and post ME (Jan 1, 2014). States that adopted ME on Jan 1, 2014 were considered exposed, while states that did not adopt ME prior to Jan 1, 2020 were considered unexposed. The 9 states that adopted ME after Jan 1, 2014 and prior to Jan 1, 2020 were excluded from analyses. Weighted percentages of children who were up-to-date (UTD) at age 24 months (receipt of the combined 7-vaccine series) were measured using individual-level data from the National Immunization Survey (NIS-Child). Rates of UTD status were compared between pre-policy (2012-2013) and post-policy (2017-2019) periods and between exposed and unexposed states (difference-in-differences). Data were analyzed using linear mixed models controlling for poverty, insurance status and census region. All calculations for UTD status and covariates were weighted to account for complex survey design. Results: There were 25,179 children in 25 exposed states and 19,895 children in 17 unexposed states. Children in unexposed states had an adjusted weighted UTD vaccination rate of 68.2% in the pre-ME period and 66.1% in the post-ME period, with an average decrease of 2.0% (p-val 0.147). In exposed states children had an adjusted weighted UTD vaccination rate of 65.3% in the pre-ME period and 66.5% in the post-ME period, with an average increase of 1.2% (p-val 0.363). The adjusted difference in these changes over time was 3.2% (p-val 0.022) (Tables 1 and 2).
Conclusion(s): Medicaid expansion was positively associated with state-level UTD vaccination rates. A possible limitation is that other unmeasured policies, interventions, or events influenced observed differences in UTD rates.
Table 1: Unadjusted and adjusted weighted percent of children up-to-date for the combined 7-vaccine series by age 24 months by state exposure to Medicaid Expansion 1. Linear mixed models adjusted for poverty, insurance coverage and census region. 2. Vaccines included in the 7-vaccine series were: >=3 doses hepatitis B (HepB), >=4 doses diphtheria, tetanus, and acellular pertussis (DTaP), >=3 or 4 doses Haemophilus influenzae type b (Hib) (depending on product type), >=4 doses pnemococcal conjugate vaccines (PCV), >=3 doses inactivated polio virus (IPV), >=1 dose measles, mumps and rubella (MMR) and >=1 dose varicella (VAR).
Unadjusted and adjusted difference in weighted percent of children up-to-date for the combined 7-vaccine series by age 24 months by state exposure to Medicaid Expansion in the pre v. post expansion time 
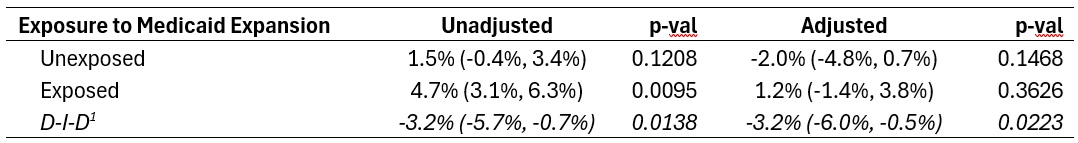
1. Linear mixed models were used to calculate a difference-in-difference for the interaction between the exposure group and time-period. Adjusted models controlled for poverty, insurance status and census region.