
Immunizations/Delivery 2
Session: Immunizations/Delivery 2
 photo")
Katelyn S. Stenger, Medical Student (she/her/hers)
Medical Student
University of Hawaii, John A. Burns School of Medicine
Honolulu, Hawaii, United States
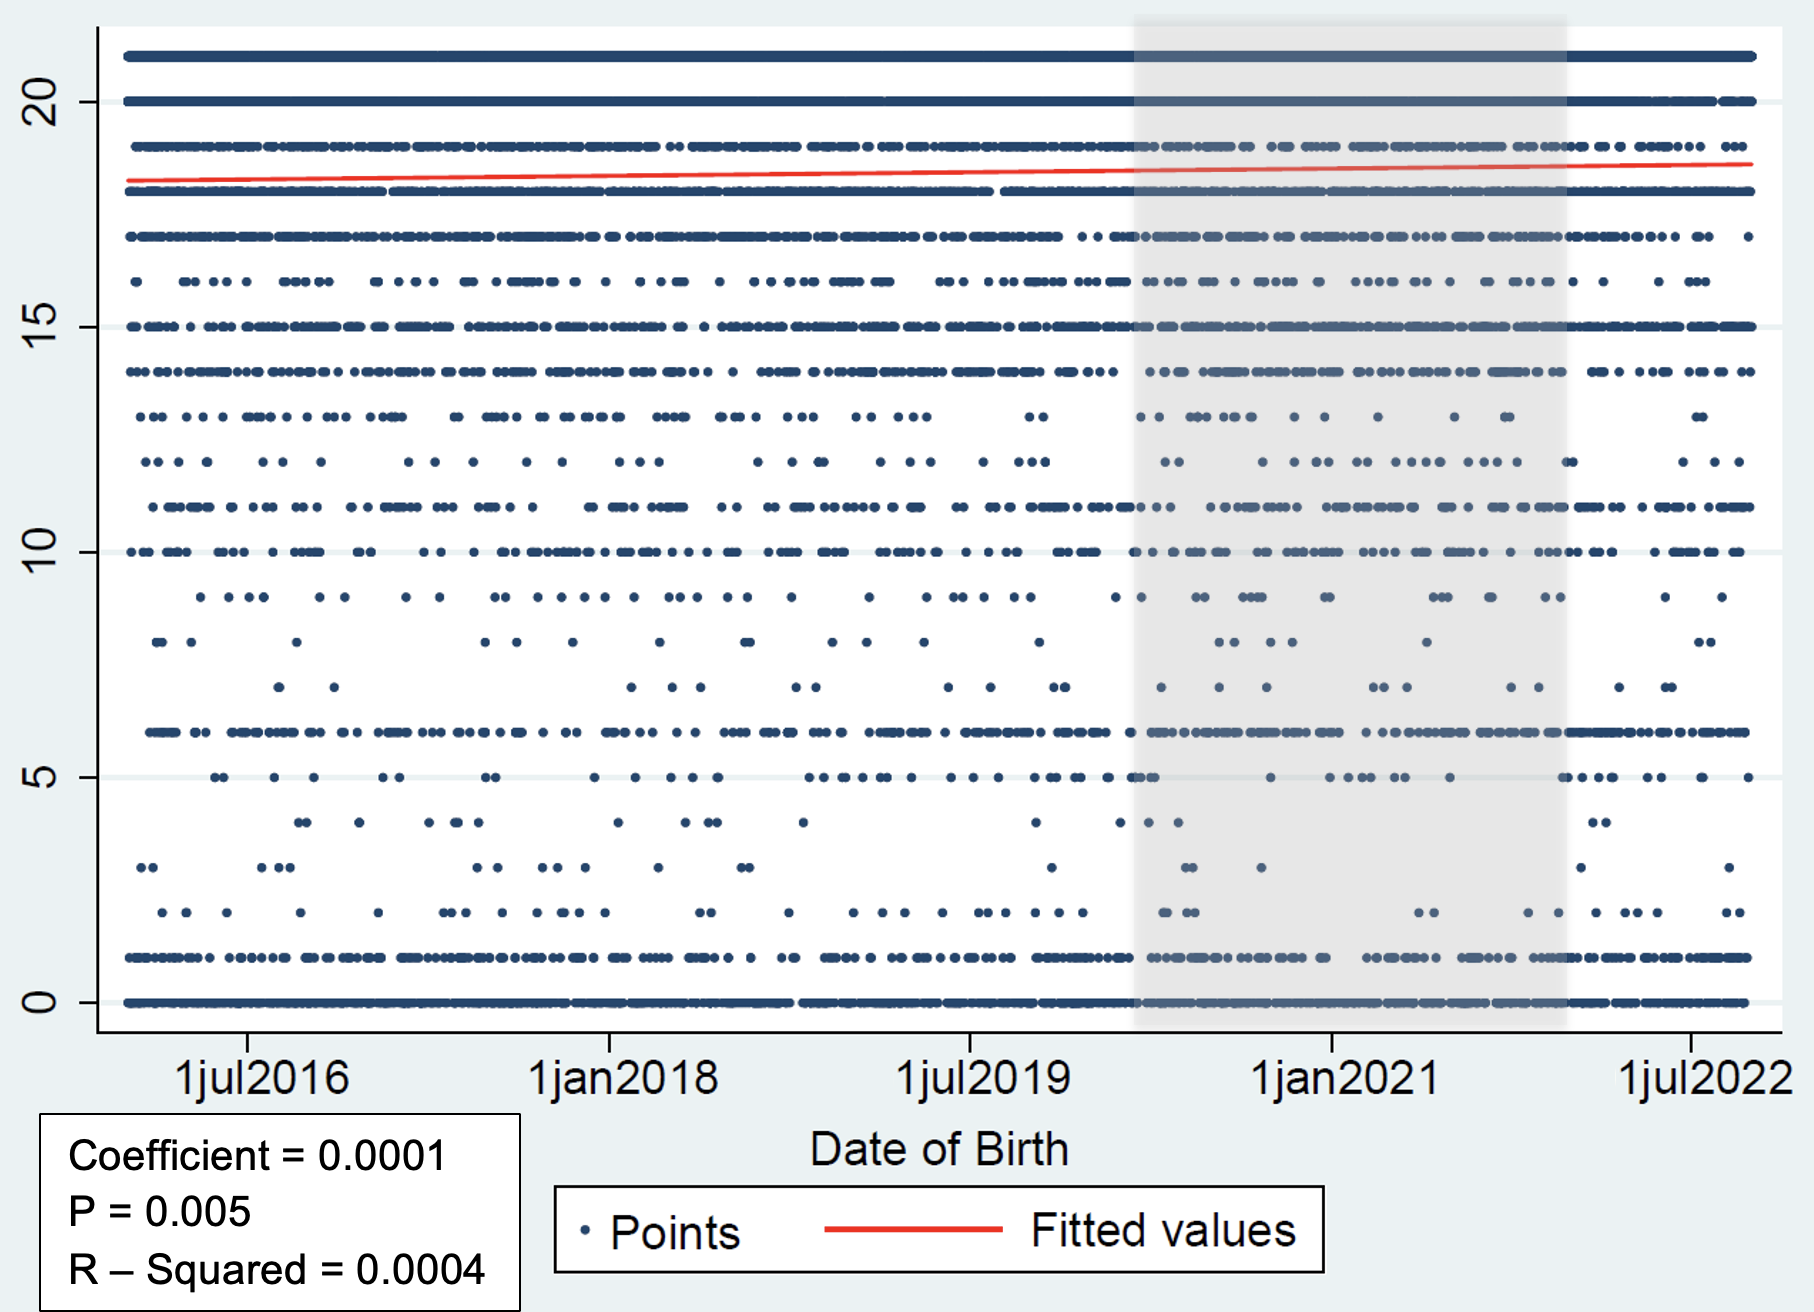 This scatterplot displays all patients within our population (20,843) in regards to their date of birth and total vaccination points received. By linear regression, we found that the amount of total points significantly increased over time (p = 0.005). The COVID period is highlighted in grey to distinguish the pre-COVID, COVID, and post-COVID periods.
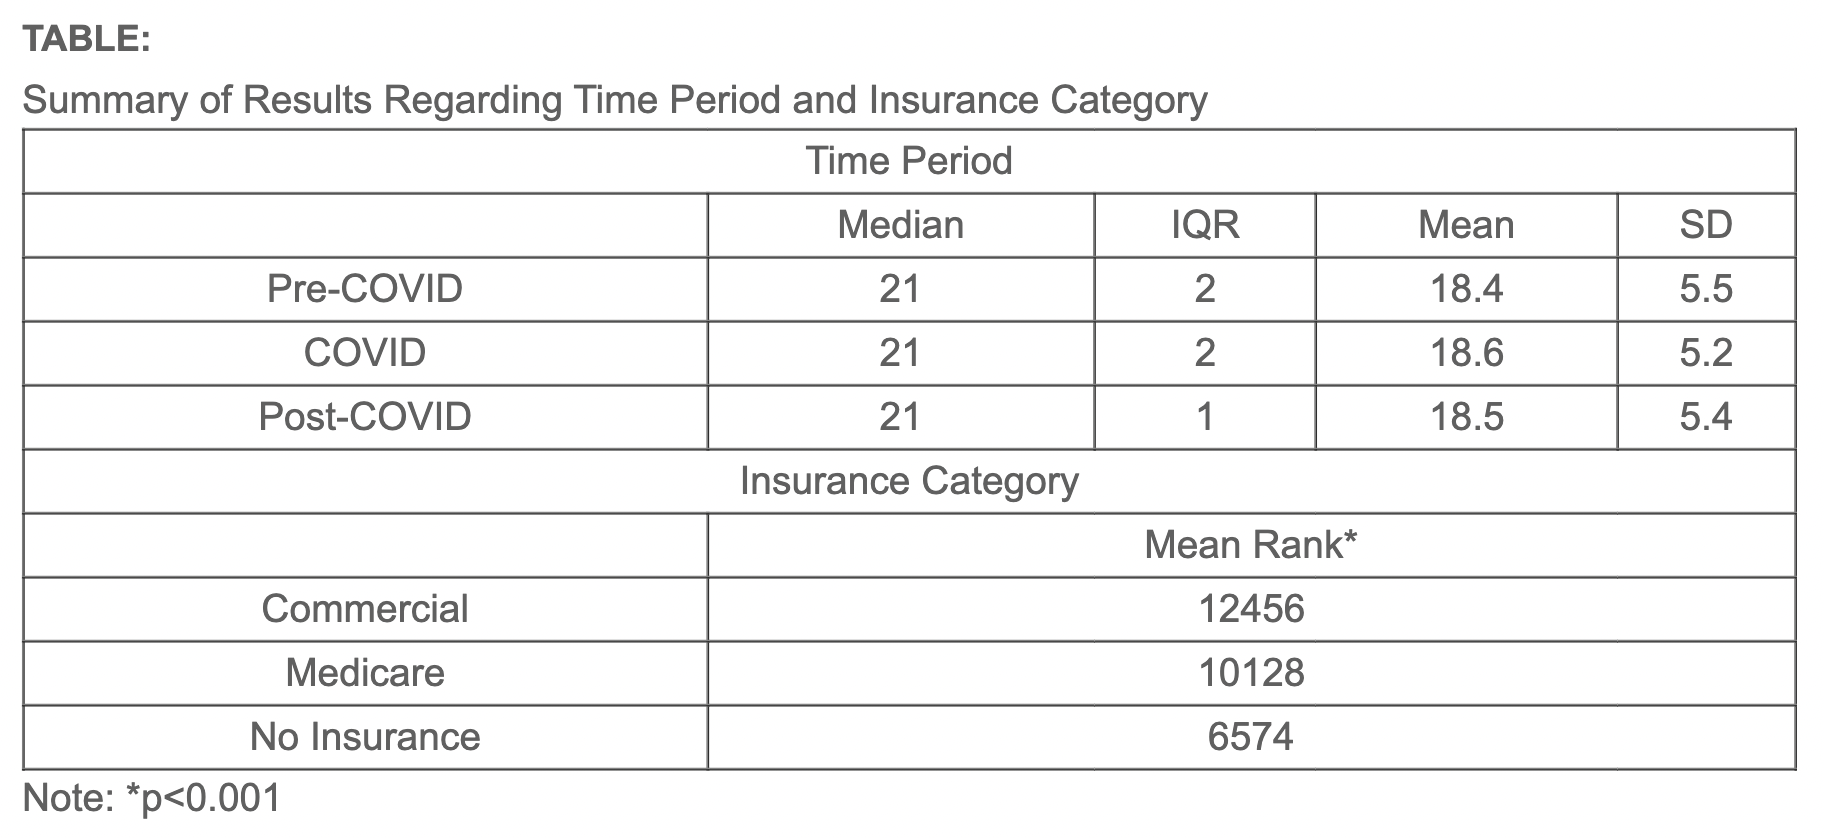 This table displays the median, interquartile range, mean, and standard deviation for patients between the Pre-COVID, COVID, and Post-COVID periods. In addition, we also looked at the effects of the insurance category on immunization status. By Kruskal Wallis, found that patients with commercial insurance had a significantly higher immunization rate than patient with Medicare and No Insurance.