
Genomics/Epigenomics 2
Session: Genomics/Epigenomics 2
 photo")
Shannon S. Hubany, BS (she/her/hers)
Medical Student
University of Central Florida College of Medicine
Orlando, Florida, United States
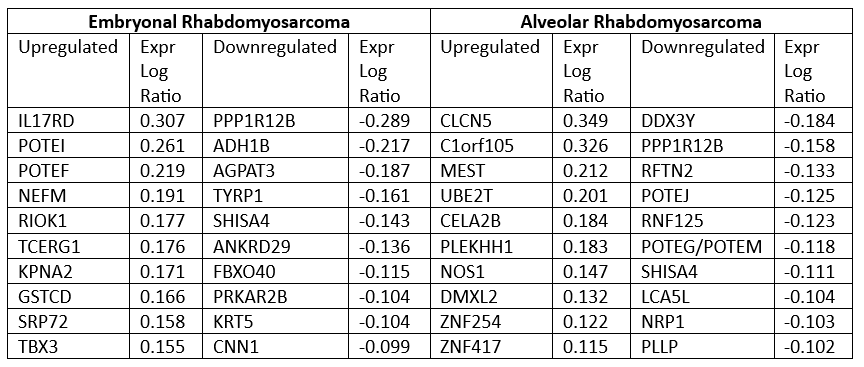 Top 10 up and down regulated genes, ranked according to experimental log ratio, for embryonal rhabdomyosarcoma (left) and alveolar rhabdomyosarcoma (right). Experimental log ratio indicates the magnitude of change on a log base 2 scale between case and control.
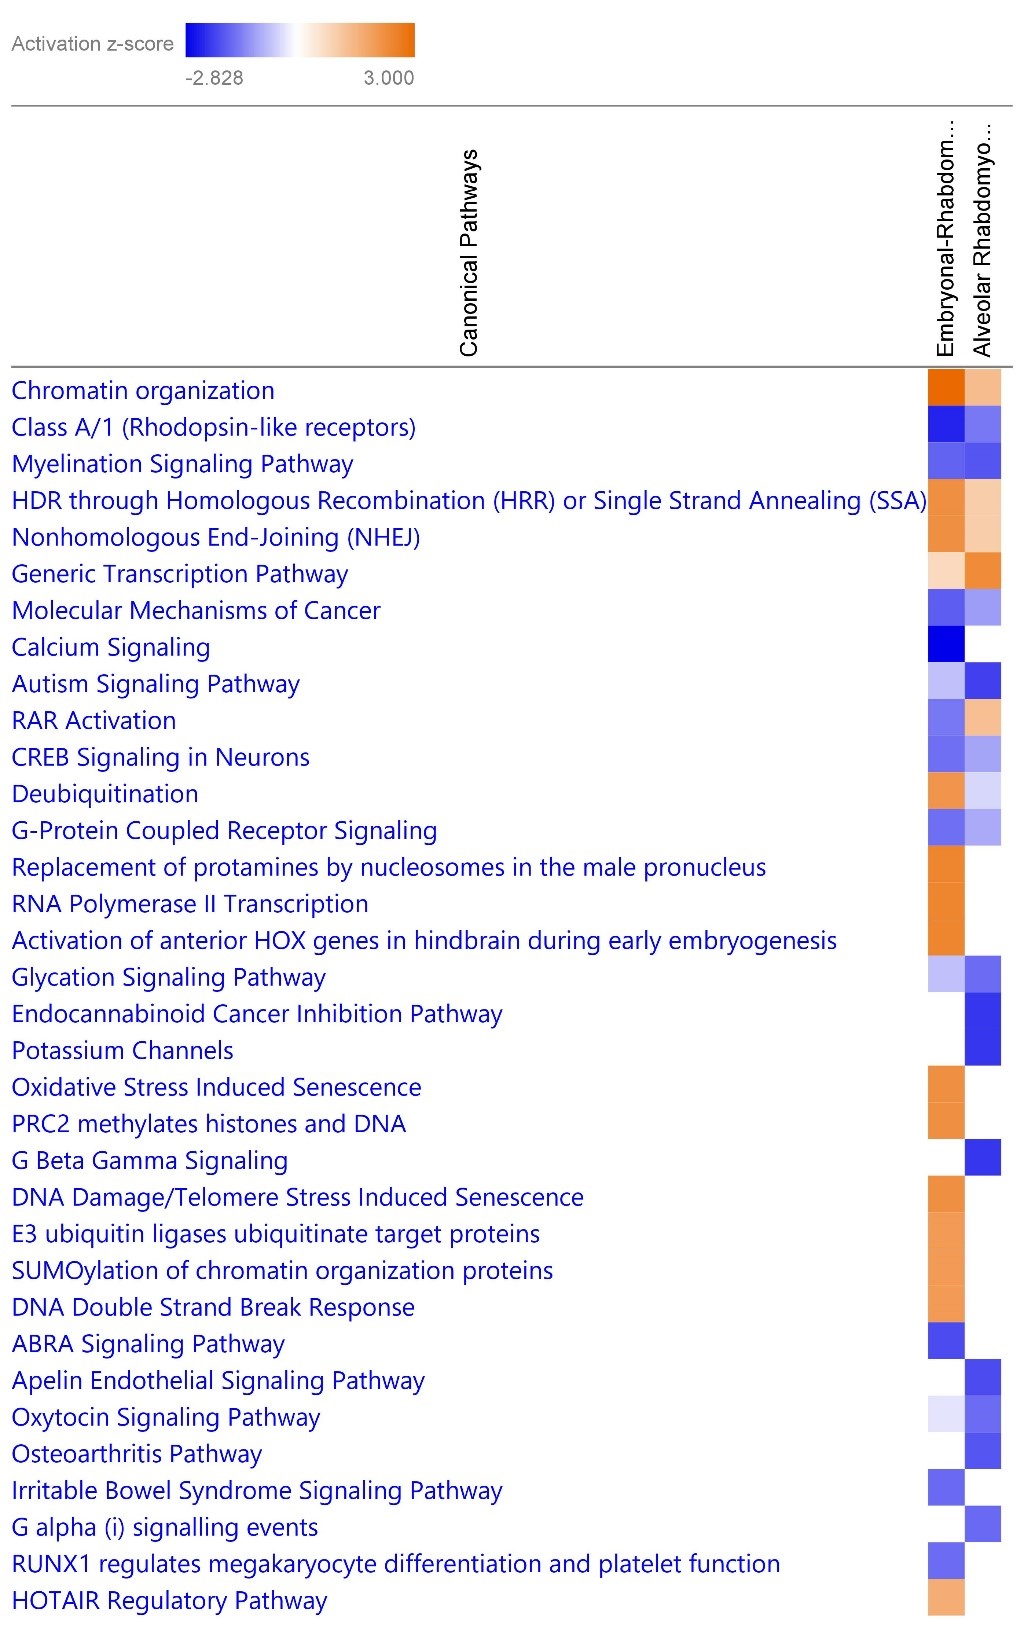 Comparison between the canonical pathways with predicted differential expression in ERMS and ARMS. Blue indicates predicted inhibition and orange indicates predicted activation. Canonical pathways with z-score >1.5 or <-1.5 are included in the heatmap.
 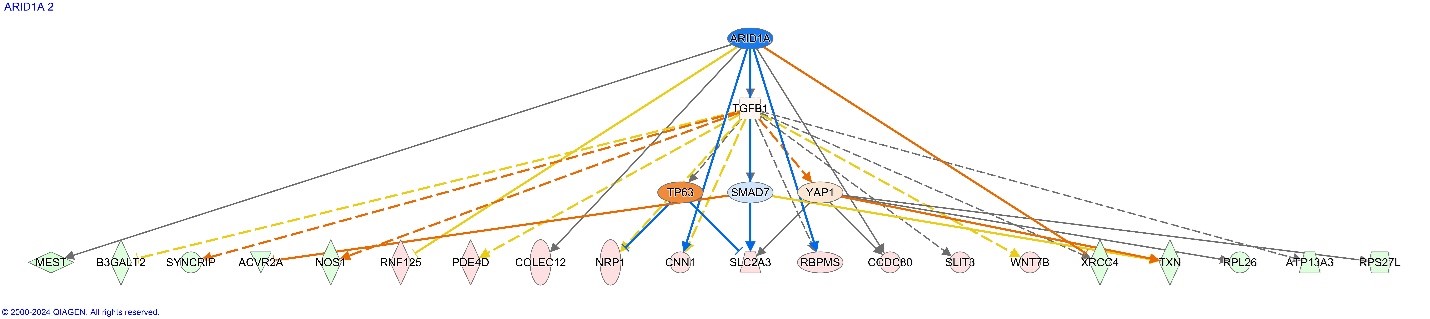 This figure depicts the top upstream regulator, ARID1A, for Alveolar Rhabdomyosarcoma with the downstream effects predicted to ensue from inhibition of ARID1A.