025 - Integrating Provider Review of Patient-Reported Outcomes at a Health System Level is Feasible and Informative
Friday, April 25, 2025
5:30pm – 7:45pm HST
Publication Number: 25.5356
Daria Ferro, Childrens Hospital of Philadelphia, Philadelphia, PA, United States; Katherine Houng, The Children’s Hospital of Philadelphia, Philadelphia, PA, United States; Caroline Burlingame, Childrens Hospital of Philadelphia, Oreland, PA, United States; Lia McNeely, Children's Hospital of Philadelphia, Malvern, PA, United States
Attending Physician Childrens Hospital of Philadelphia Philadelphia, Pennsylvania, United States
Background: Patient-Reported Outcomes (PROs) are increasingly valued in healthcare for enhancing patient care. However, capturing provider reviews of PROs results and their influence on shared decision-making remains challenging. In our large pediatric health system, a program was initiated in 2018 to embed PROs into clinical practice and enable quality improvement initiatives. We created a framework (Figure 1) to support this integration, analogous to medication prescribing. To operationalize this, we used electronic health record (EHR) tools with customizable presentations to providers while adhering to a standard data model that attempts to capture PROs review timing and their potential impact on clinical decision-making. Objective: To evaluate (“study”) our provider review approach for PROs in outpatient subspecialty care, where it has been active for over a year. Design/Methods: As part of a "study" phase of our program level "plan-do-study-act" cycles, we conducted a retrospective analysis of the provider review process for PROs across clinical areas active for over a year. Using enterprise self-service analytics tools, we summarized provider review rates and categories to guide future program enhancements in meaningfully integrating PROs into clinical care delivery. Results: We reviewed 92,817 encounters across seven clinical areas with PROs implementations from 2021 to 2023 (Table 1). The completion rate for PROs by patients/caregivers was 74%, while the provider review rate for encounters with assigned PROs was 68%. Detailed analysis of provider responses is in Table 2. Providers indicated that PROs influenced medical decisions in at least 13% of encounters where results were available. Providers noted missing PROs data in 45% of encounters where PROs were not completed as assigned.
Conclusion(s): Integrating provider reviews of PROs into clinical care is both feasible and effective. Our framework, modeled after medication reconciliation, is readily understood by providers. Our adaptable EHR tools align with clinical workflows, reducing implementation barriers while maintaining reporting quality. This integration fosters improved reporting and continuous system-level quality enhancements. The documentation of incomplete PROs by providers may indicate opportunities for better patient care, such as discussing the importance of PRO completion and addressing barriers. Insights into how providers utilize PROs are essential for maximizing their potential.
Figure 1. Conceptual Model of PROs Delivery 
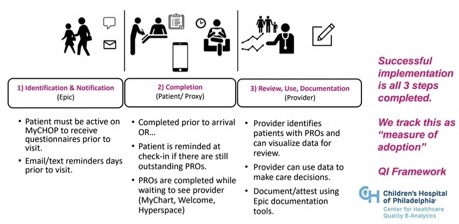
Phase 1 analogous to order for medication/ prescription taking place. Phase 2 analogous to patient/caregiver “filling” med or completing the order. Phase 3 analogous to provider performing “reconciliation.” Our data model tracks each of these three phases to provide insights and potential plan-do-study-act cycles that are independent from one another but synergistically related.
Table 1. Counts of Encounters where PROs Implemented Across 7 Clinical Areas 
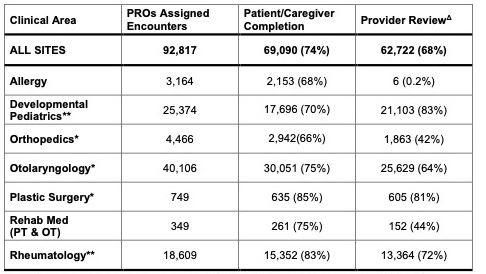
Table 1 represents clinical areas where PROs implementation includes a mechanism for provider documentation for at least 1 full calendar year.
*Denotes sites have data included from 2 years (2022, 2023).
**Denotes sites that have data included from 3 years (2021, 2022, 2023).
ΔProvider review is decoupled from completion such that providers can document they looked for results, but that the PROs were incomplete. This is analogous to discussing medication that was prescribed but not filled and is why Provider Review may be higher than Completion. Variability in Provider Review is likely due to combination of factors including different electronic health record tools, clinical workflows, scope of attempted patient reach, and team dynamics, which can be discussed in presentation.
Table 2. Encounter Level Provider Review Selections for Insights on PROs Influences 
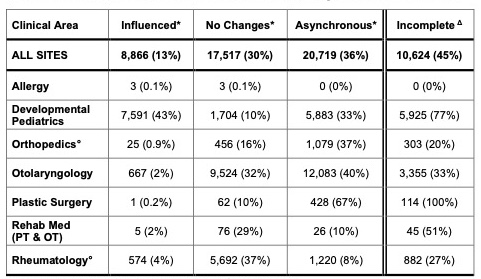
Providers select documentation that maps to four categories:
1) Influenced: Provider reviewed PROs results during encounter (presumably with patient/caregiver) and documented that the PROs results influenced the plan of care.
2) No Changes: Provider reviewed PROs results during encounter (presumably with patient/caregiver) and documented that the PROs results did not lead to changes in plan of care at that time.
3) Asynchronous: Providers reviewed PROs apart from the encounter. We presume this is typically in the after-encounter progress note completion where the decision making for that encounter has already taken place.
4) Incomplete: Providers document that they have looked for PROs results and choose this response if there is no data. This gives providers the opportunity to document that they are still performing the desired behavior (i.e., looking for results) and presents potential opportunities including discussion of barriers to PROs completion with patients.
*Denominator is total encounters with completed PROs for these categories (i.e., could not document that the results influenced if the value not present/ PRO incomplete).
Δ Denominator is total encounters with incomplete PROs (i.e., where PROs assigned but not completed, how often did providers still document that they looked for the results?) In addition to the category description above, it could be considered as a future incentive metric for providers.
°Sum of row values not equal to provider review total in Table 1. Rationale: Not all implementations of PROs in these clinical areas included opportunities for capturing the 4 categories (e.g. due to implementation prior to our program involvement). Data shown represents only encounters where opportunity for four categories capture. Denominators remain as listed above and therefore percentages likely underrepresent true values.