
Neonatal/Infant Resuscitation 2
Session: Neonatal/Infant Resuscitation 2
.jpg "Randolph J. Sinahon (he/him/his) photo")
Randolph J. Sinahon (he/him/his)
PhD Candidate
Drexel University
Tinton Falls, New Jersey, United States
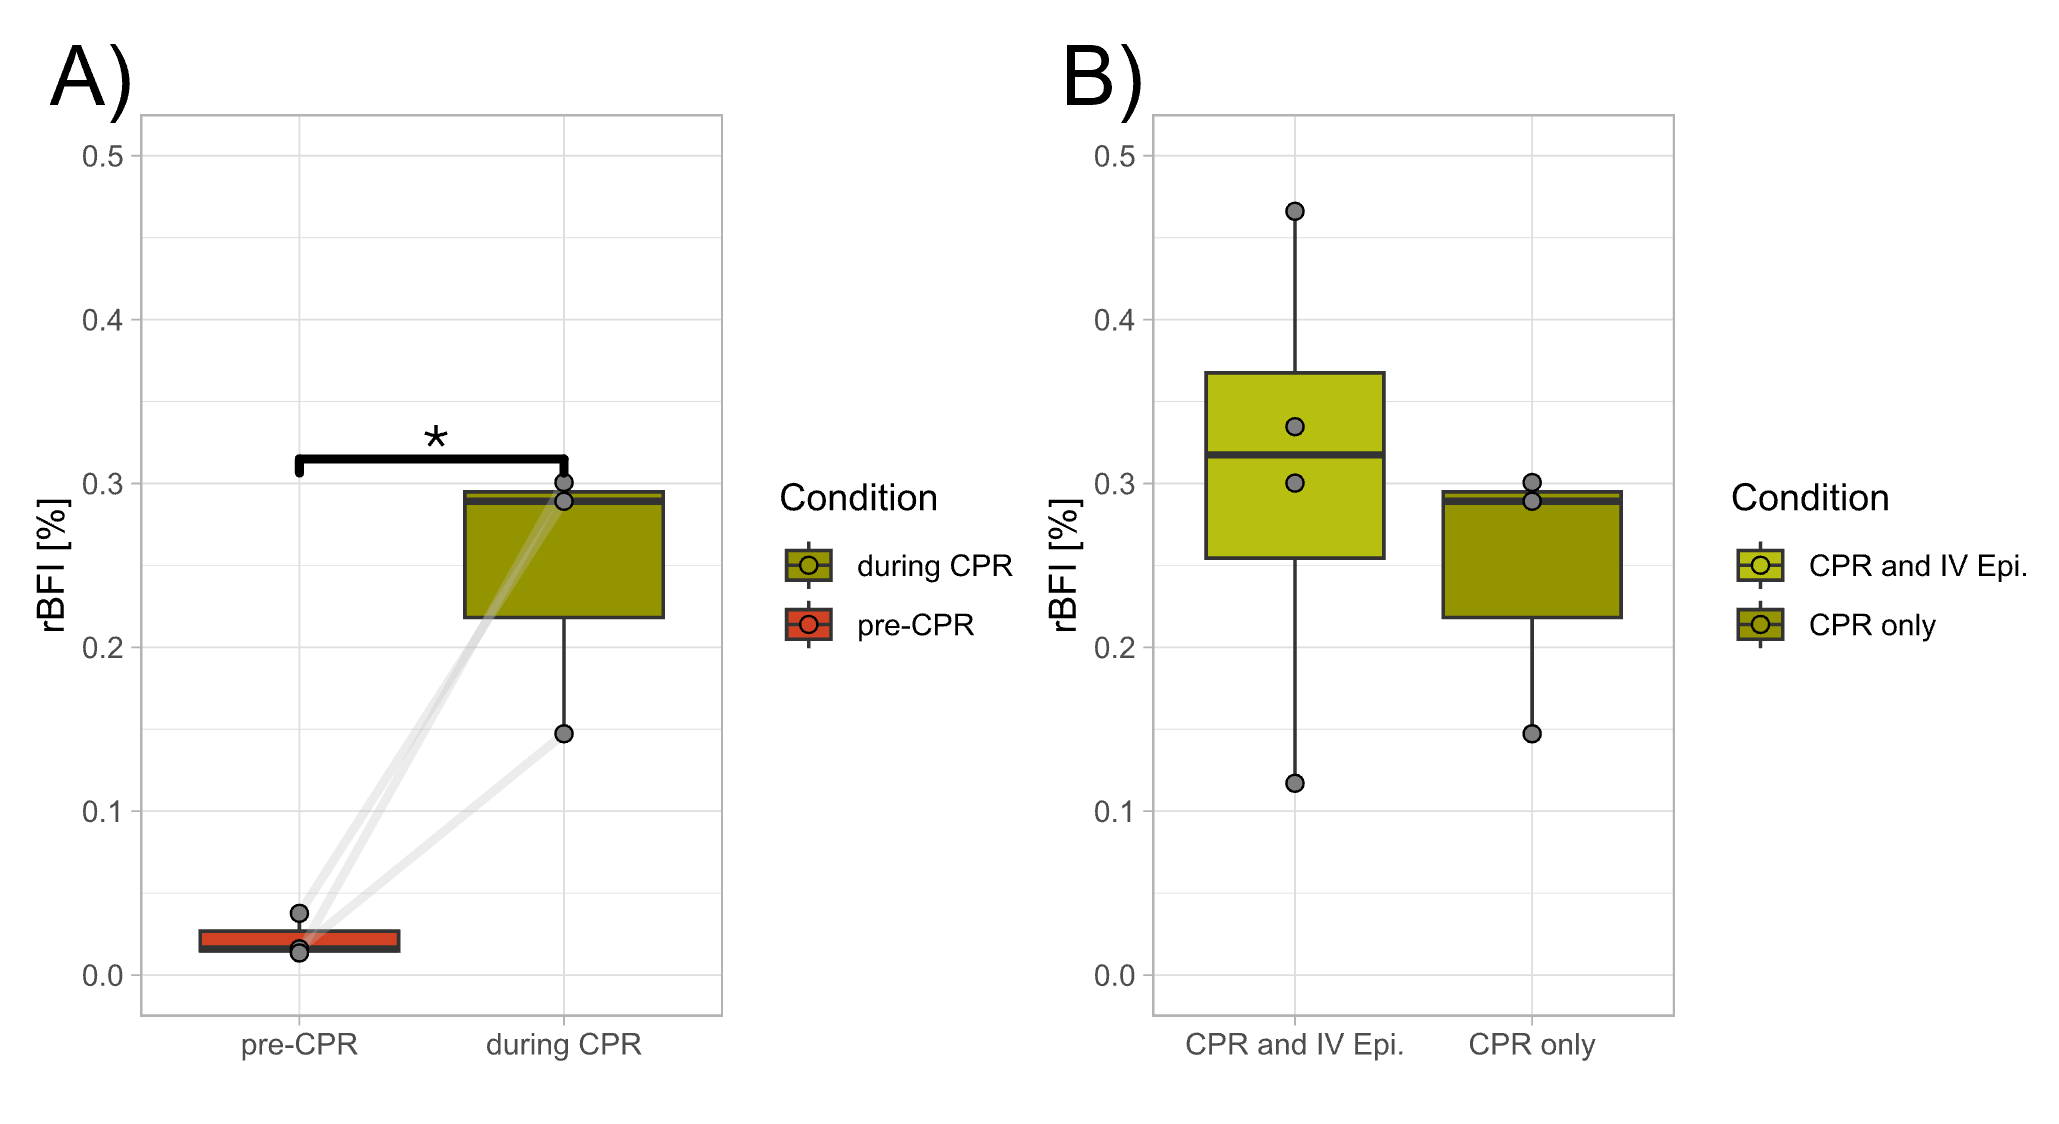 Figure 1: (A) Relative blood flow (rBFI) indices during circulatory collapse pre-CPR, and during CPR in piglets that did not receive initial intravenous epinephrine doses (n=3); Light gray lines represent individual animal responses (Two-tailed paired t- test; *p < 0.05, Hedges’ g=1.56). (B) rBFI during CPR with (n=3) and without (n=4) intravenous epinephrine (independent samples t-test; p= non-significant).
 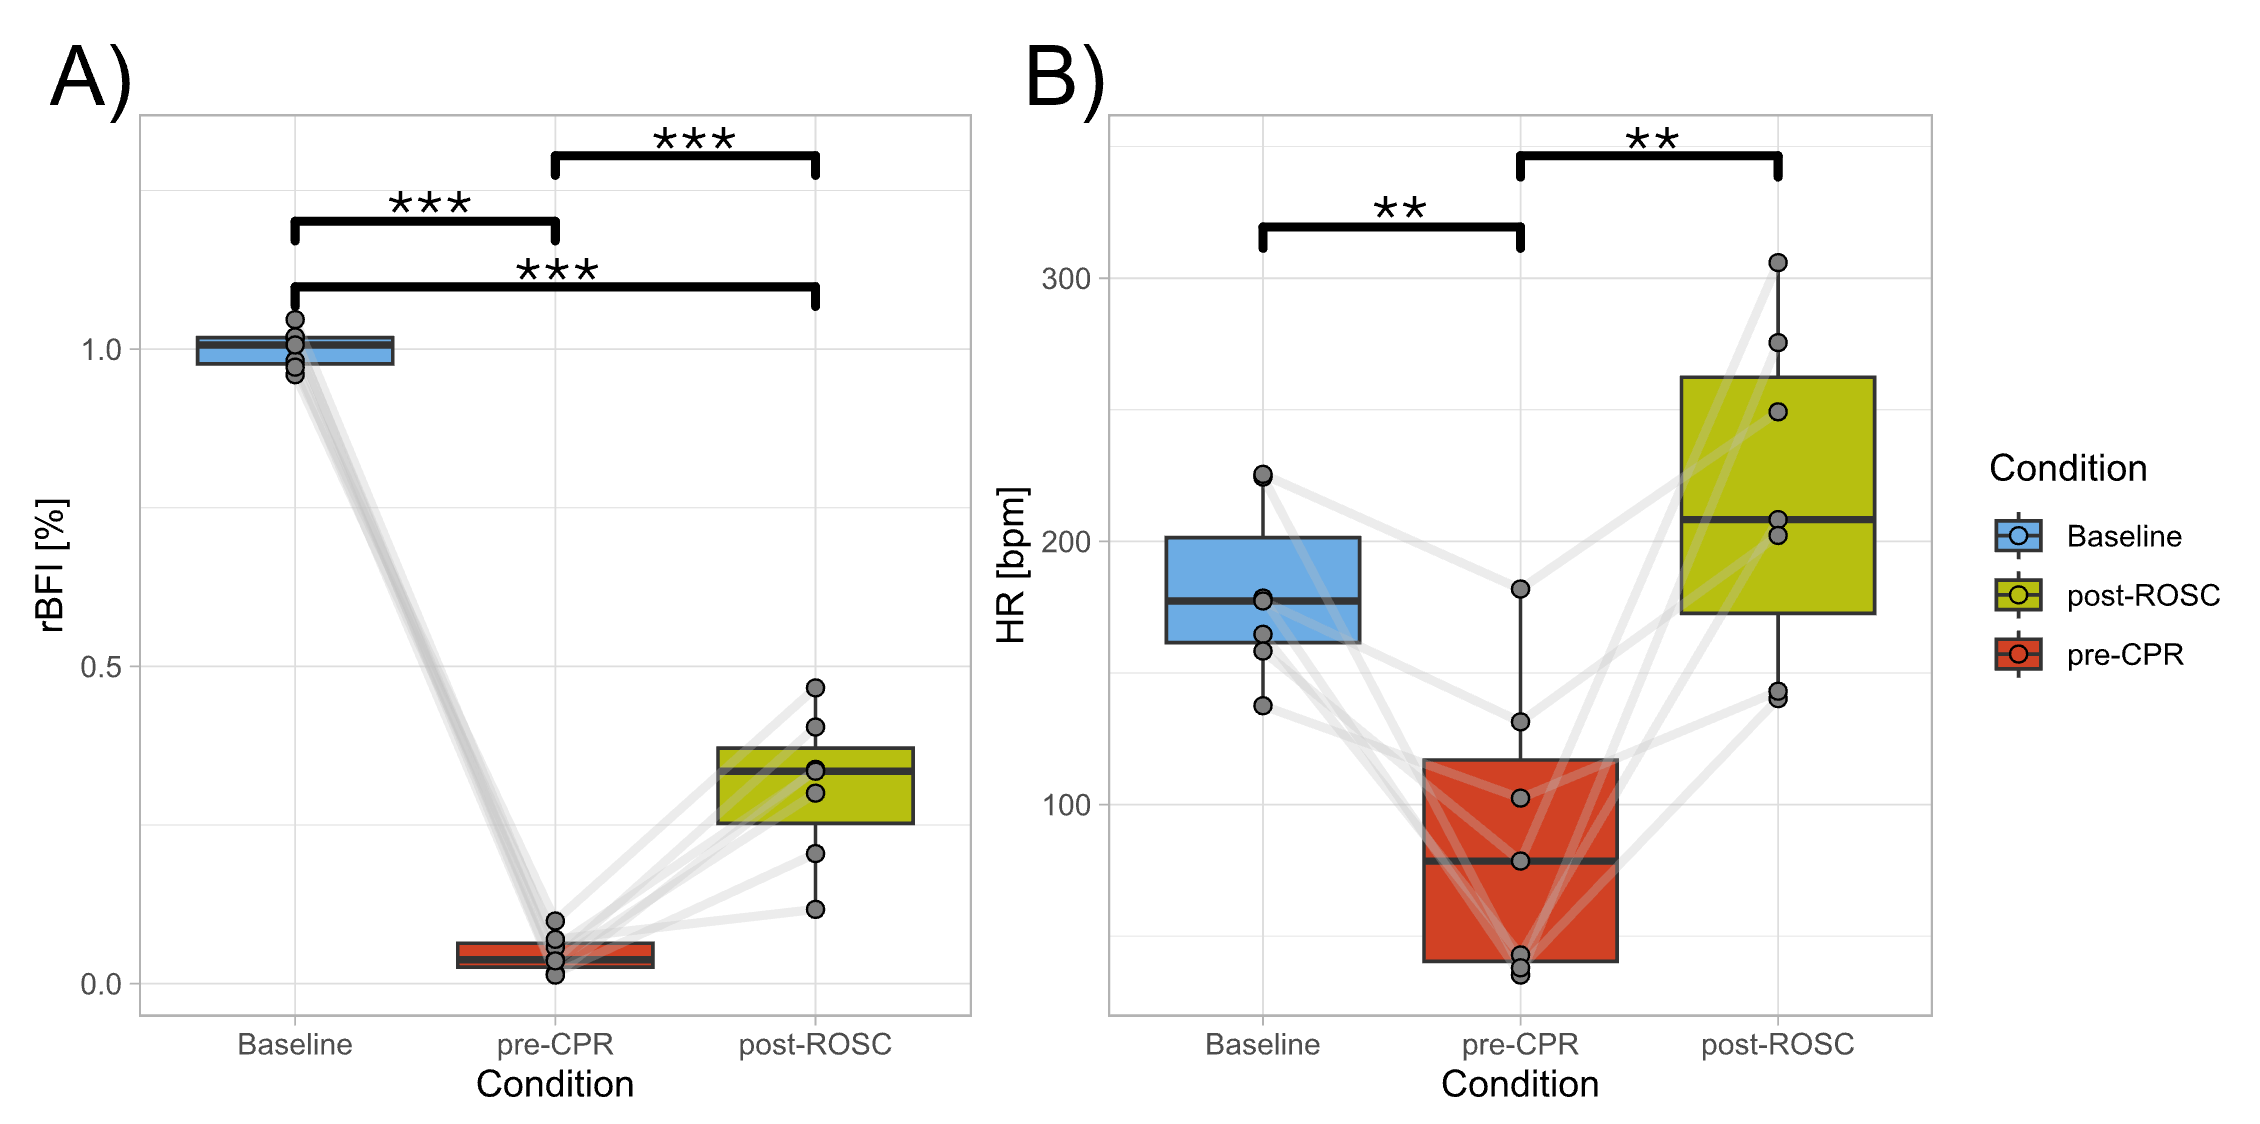 Figure 2: Repeated measures ANOVA and post hoc tests with false discovery rate corrections were used to compare (A) relative blood flow indices (rBFI; F(2,12)=349, ηp²=0.97) and (B) Heart Rate (HR; F(2,12)=13, ηp²=0.57) across Condition: Baseline, Circulatory Collapse/pre-CPR, and after Resuscitation/post-ROSC (n=7). Light gray lines represent individual animal responses (***p < 0.001, **p < 0.01). Hedges’ g effect sizes: rBFI Baseline v.s. pre-CPR (g=-16.3), pre-CPR v.s. post-ROSC (g= 2.01), and Baseline v.s. post-ROSC (g=-5.15); HR Baseline v.s. pre-CPR and pre-CPR v.s. post-ROSC (g=-1.40 and 1.41 respectively).