Session: Neonatal General 4: Novel Technology and Therapies
799 - Non-contact Vital Sign Monitoring Technologies for the Neonatal Intensive Care Unit: A Systematic Review
Friday, April 25, 2025
5:30pm – 7:45pm HST
Publication Number: 799.5780
Eva B. Senechal, McGill University Faculty of Medicine and Health Sciences, Montreal, PQ, Canada; Alyssa Maximov, McGill University Faculty of Medicine and Health Sciences, Montréal, PQ, Canada; Emily Jeanne, McGill University Faculty of Medicine and Health Sciences, Montreal, PQ, Canada; Daniel J. Radeschi, McGill University Faculty of Medicine and Health Sciences, Pointe Claire, PQ, Canada; Amanda Gross, McGill University Faculty of Medicine and Health Sciences, Montreal, PQ, Canada; Vivian M.G.O. Azevedo, Universidade Federal de Uberlândia, Uberlandia, Minas Gerais, Brazil; Wissam Shalish, McGill University Faculty of Medicine and Health Sciences, Montreal, PQ, Canada; Robert E. Kearney, McGill University Faculty of Medicine and Health Sciences, Montreal, PQ, Canada; Guilherme Sant'Anna, McGill University, Montreal, PQ, Canada
PhD. Candidate McGill University Faculty of Medicine and Health Sciences Montreal, Quebec, Canada
Background: In the NICU vital signs are continuously detected using adhesive sensors connected to bedside monitors via wires and cables. Adhesives can damage fragile neonatal skin, and the numerous wires are cumbersome, limit patient mobility, and hinders parents’ ability to interact with their children. Due to these challenges, there is growing research in developing non-contact methods for vital sign monitoring in the NICU. Objective: This systematic review aims to identify and describe the non-contact vital sign monitoring technologies being developed for the NICU, provide a summary of the performance of these technologies, and appraise the methodology and quality of these studies. Design/Methods: A systematic search of the literature published after 2014 was conducted in August 2024 with assistance from a librarian in Medline, Embase, Scopus, Engineering Village, Cochrane, and Web of Science for non-contact vital sign monitoring technologies used in the NICU. Results were exported to Covidence literature review software where two investigators independently reviewed articles to determine eligibility. Data from articles was extracted by two independent reviewers using a data collection form designed with input from neonatologists and engineers. Risk of bias and applicability concerns were assessed using the QUADAS-2 tool. A descriptive analysis was applied. Results: Of 3051 articles identified, 43 were included in this review. All included studies were prospective observational studies, primarily from Europe (n=22, 51%). Most studies included a median sample size of 8 infants, and median recording durations of 0.30 hours on premature and low birthweight infants (Tables 1 and 2). The most commonly used non-contact sensors were RGB cameras, and the most common vital signs monitored were respiratory rate (RR) and heart rate (HR) (Table 2). Most studies exclusively focused on examining accuracy using Bland Altman analysis (Table 2). It was difficult to assess risk of bias and applicability of participants and the index measurements due to incomplete information about conflict of interest, participant selection and characteristics, and constraints on experimental conditions in the NICU (Table 3).
Conclusion(s): Investigations to develop non-contact vital sign monitoring technologies for the NICU are primarily pilot studies with few patients and very short recording durations. They also often provided incomplete information about participants and study methodology, making it difficult to assess methodological quality. This highlights the importance of developing rigorous standardized reporting practices for this field.
Table 1. Participant Information Legend: Data are presented as n (%). In certain cases, more than one study site, or age category was included in study thus each category included was counted, or certain information was not provided and therefore the study was not counted in the results
Table 2. Study Device and Methodology Legend: Data are presented as n (%).
Figure 1 - QUADAS 2 Assessment 
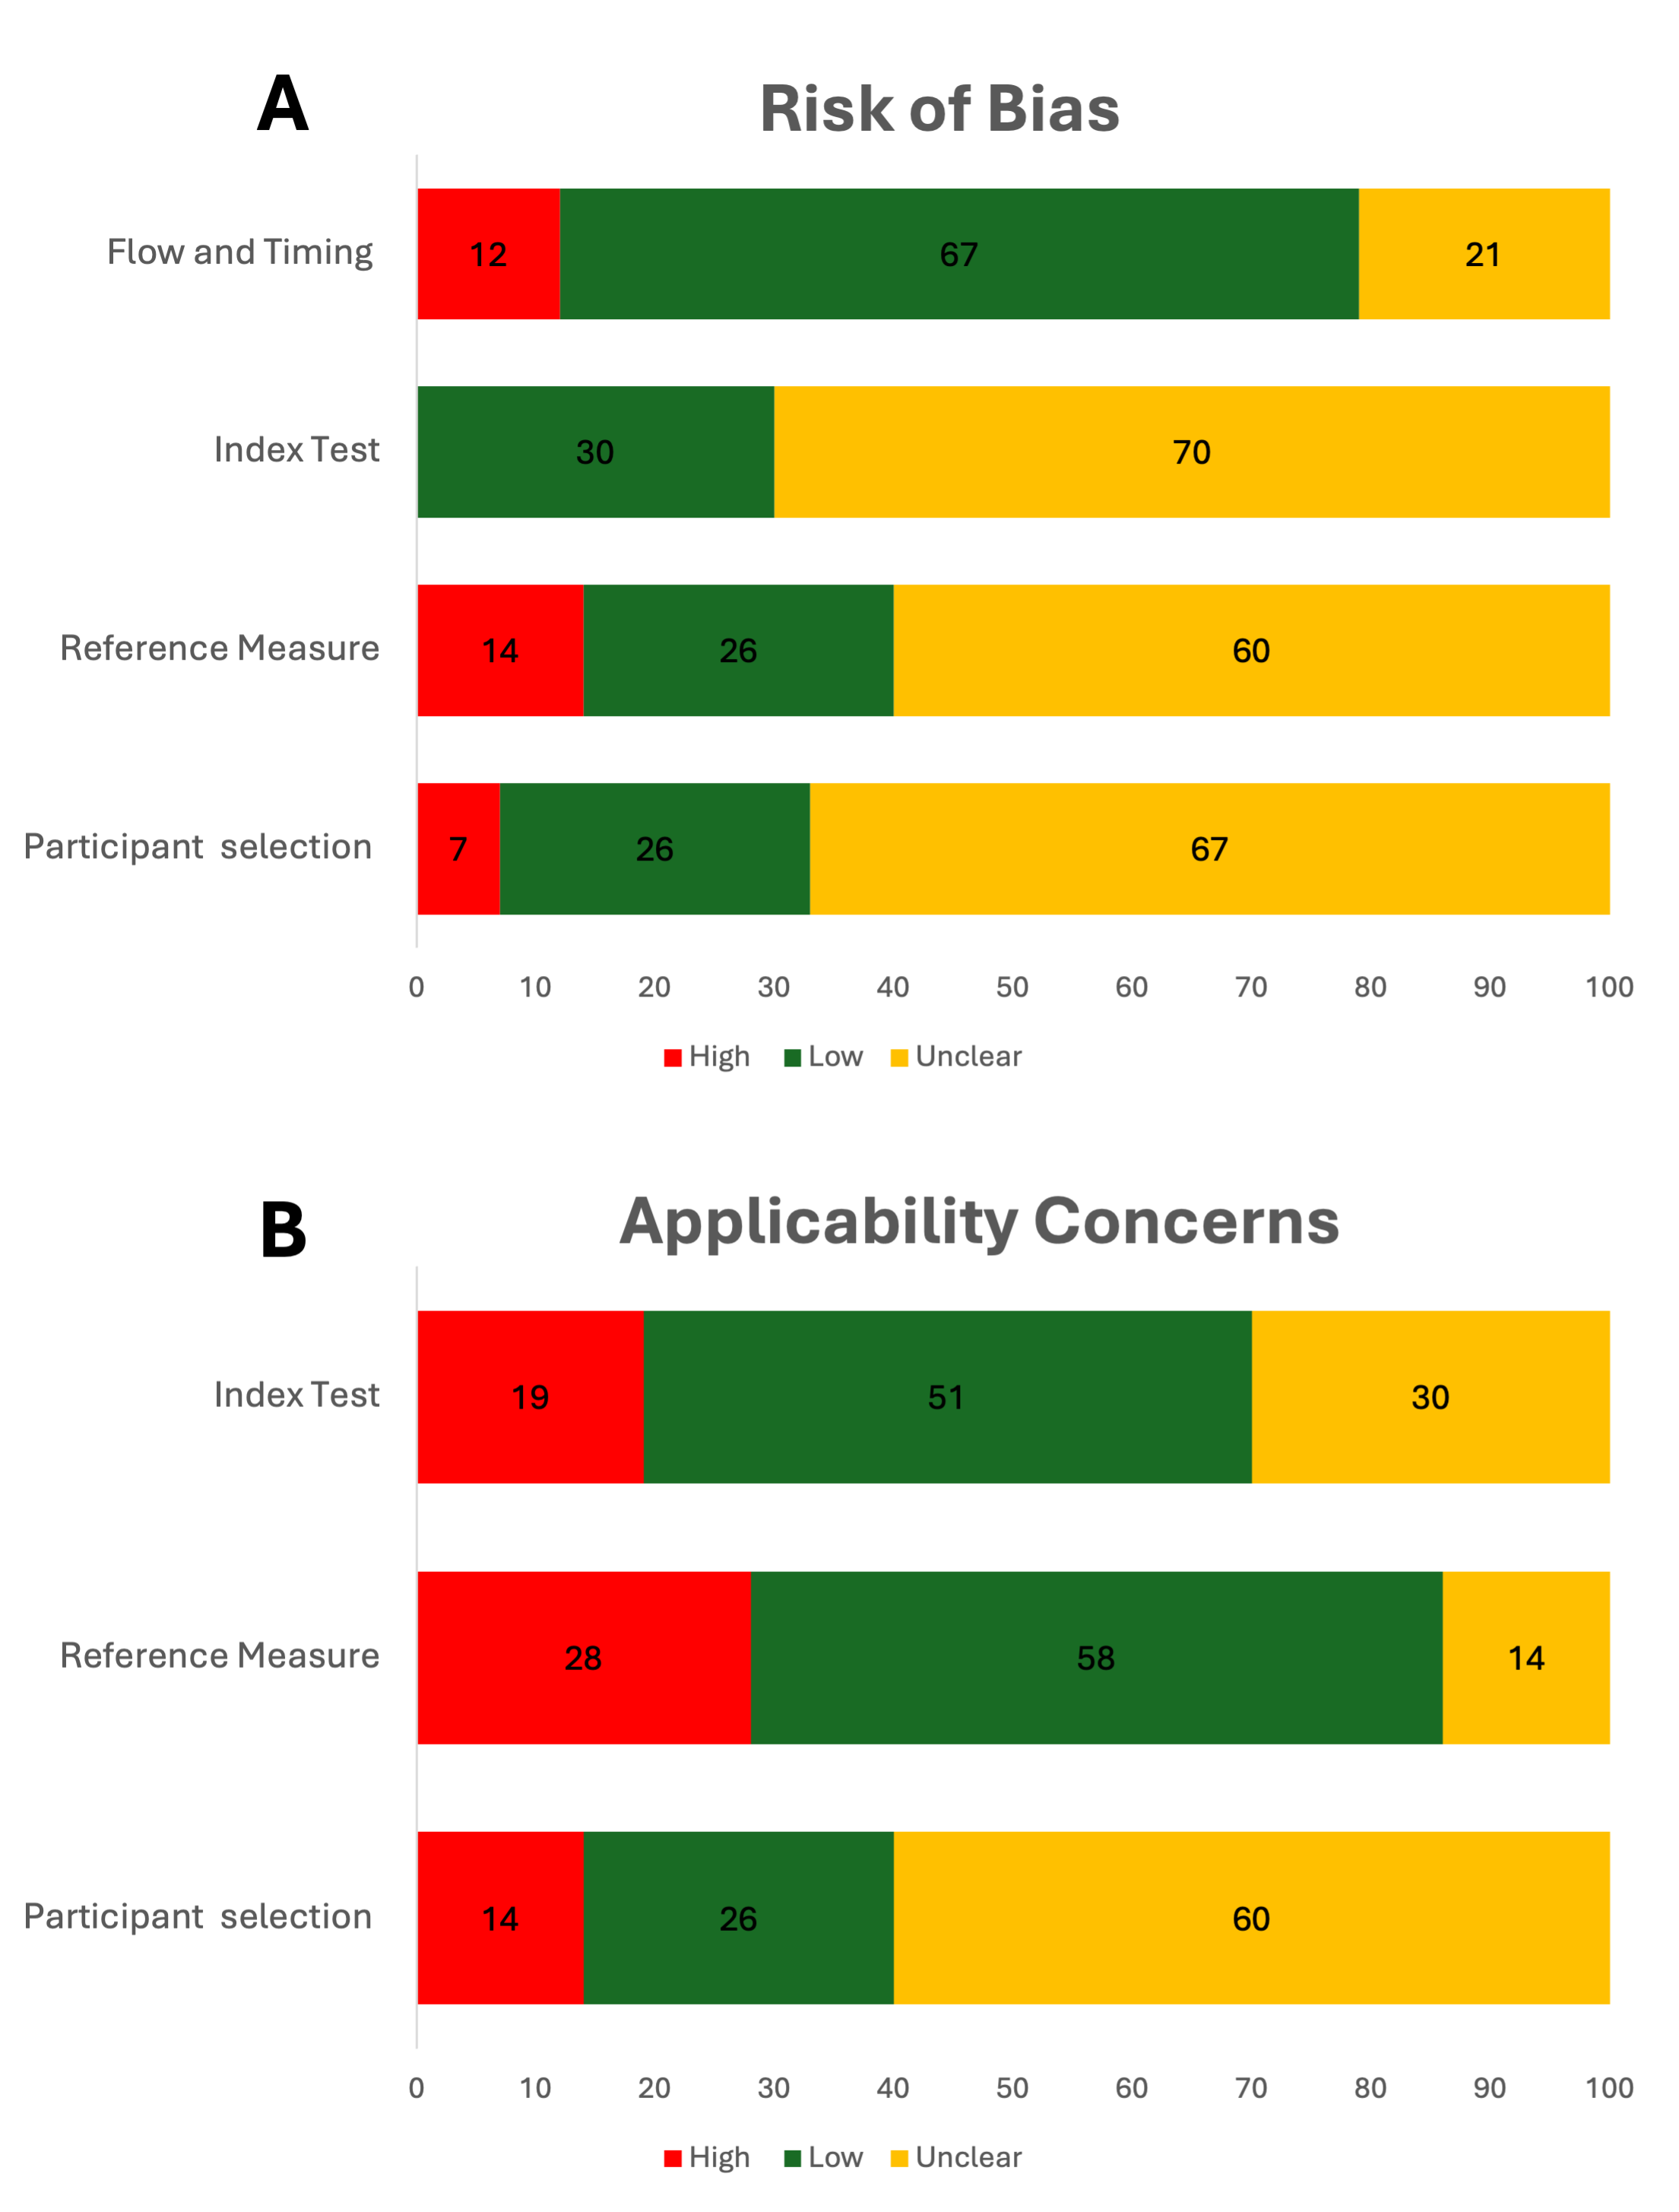
Panel A represents risk of bias for each category, Panel B represents applicability for each category (ecxluding flow and timing). Data are presented as % of all included studies.