
Neonatal/Infant Resuscitation 1
Session: Neonatal/Infant Resuscitation 1
 photo")
Jacqueline Hannan, PhD (she/her/hers)
Human Factors Researcher
University of Michigan
Ann Arbor, Michigan, United States
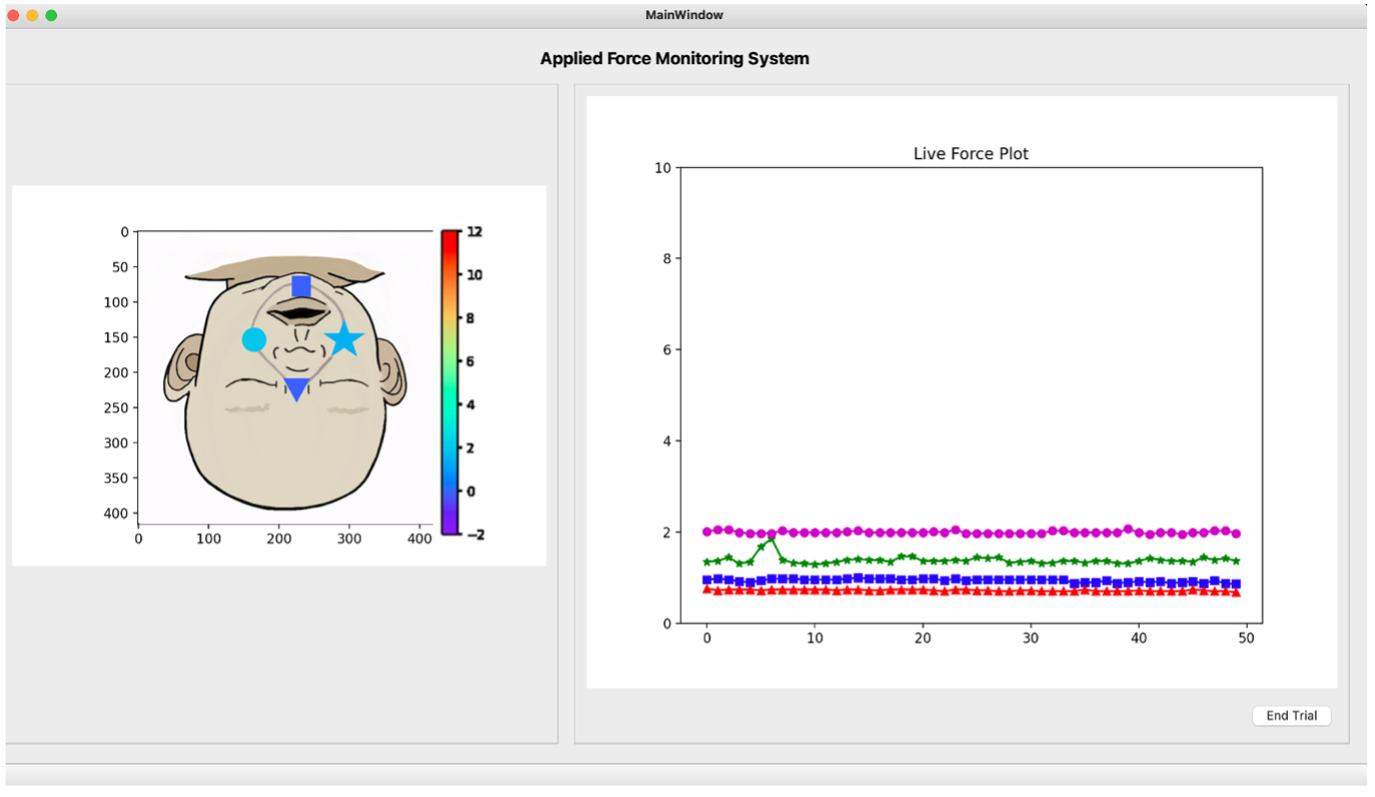 Custom interface designed to present live force feedback; left side: face-mapping diagram, right side: time series plot.
 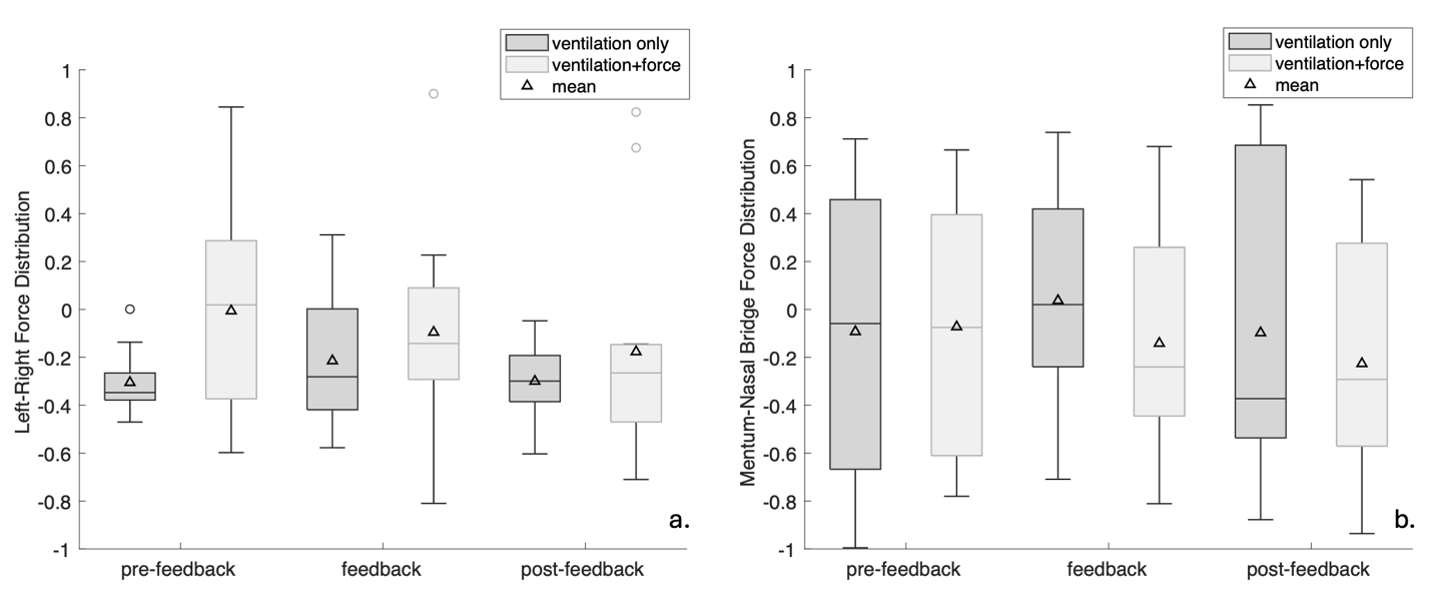 Force distribution on the face sensors for each trial, grouped by feedback condition. Values are represented as a ratio of the force difference to the total force applied in the respective directions. 2a. Average left-right force distribution for each trial. Positive values indicate greater left force; negative values indicate greater right force. 2b. Average chin-nose force distribution for each trial. Positive values indicate greater chin force; negative values indicate greater nose force.
 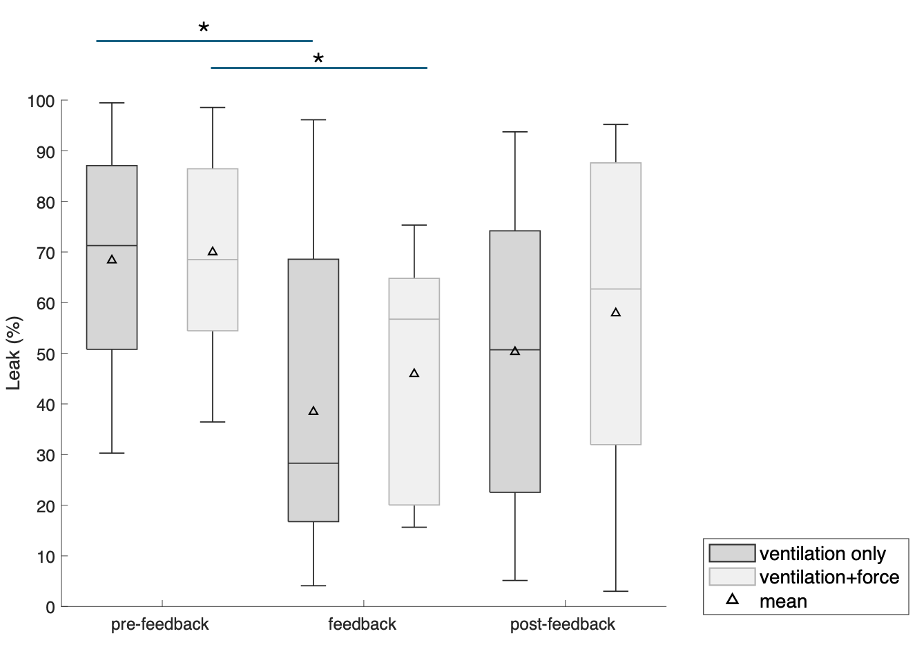 Percent mask leak for each trial, grouped by feedback condition. Asterisk indicates significance between groups. Custom interface designed to present live force feedback; left side: face-mapping diagram, right side: time series plot. Force distribution on the face sensors for each trial, grouped by feedback condition. Values are represented as a ratio of the force difference to the total force applied in the respective directions. 2a. Average left-right force distribution for each trial. Positive values indicate greater left force; negative values indicate greater right force. 2b. Average chin-nose force distribution for each trial. Positive values indicate greater chin force; negative values indicate greater nose force. Percent mask leak for each trial, grouped by feedback condition. Asterisk indicates significance between groups.