
Quality Improvement/Patient Safety 5
Session: Quality Improvement/Patient Safety 5
 Credit")
 photo")
Cindy Do, MD (she/her/hers)
Resident Physician
NewYork-Presbyterian Komansky Children’s Hospital
Brooklyn, New York, United States
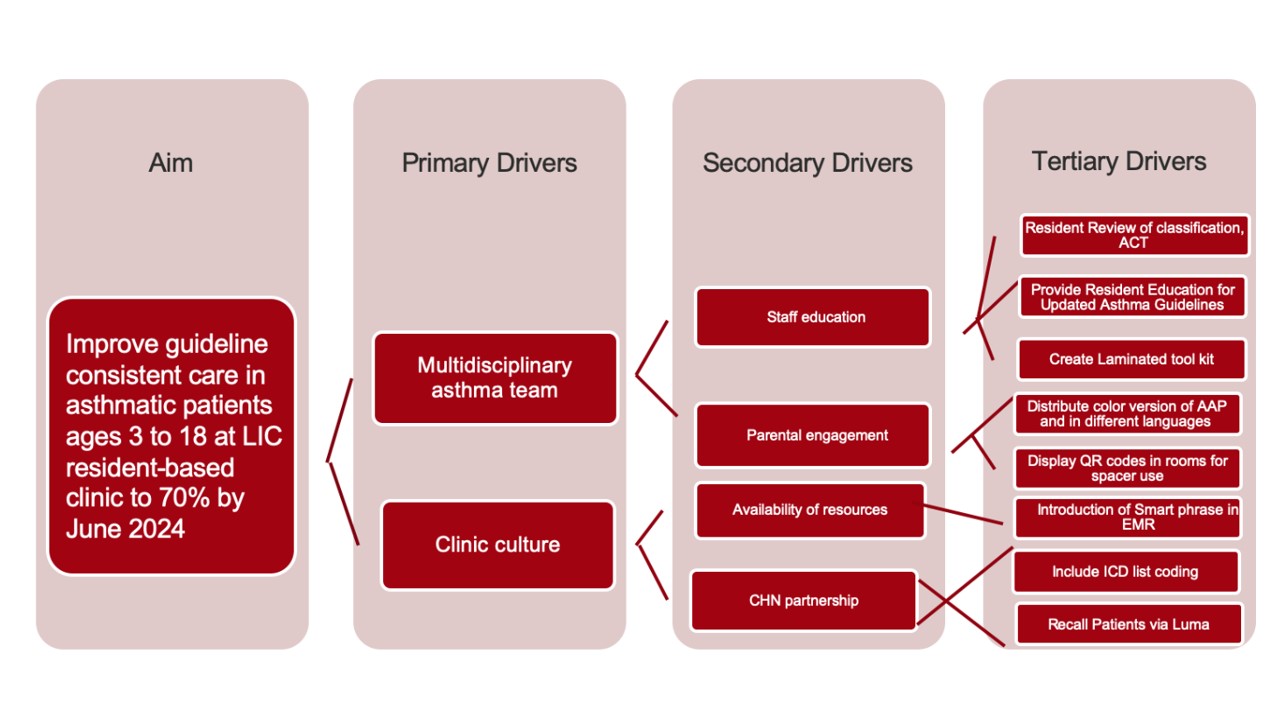 Figure 1. Key Driver Diagram
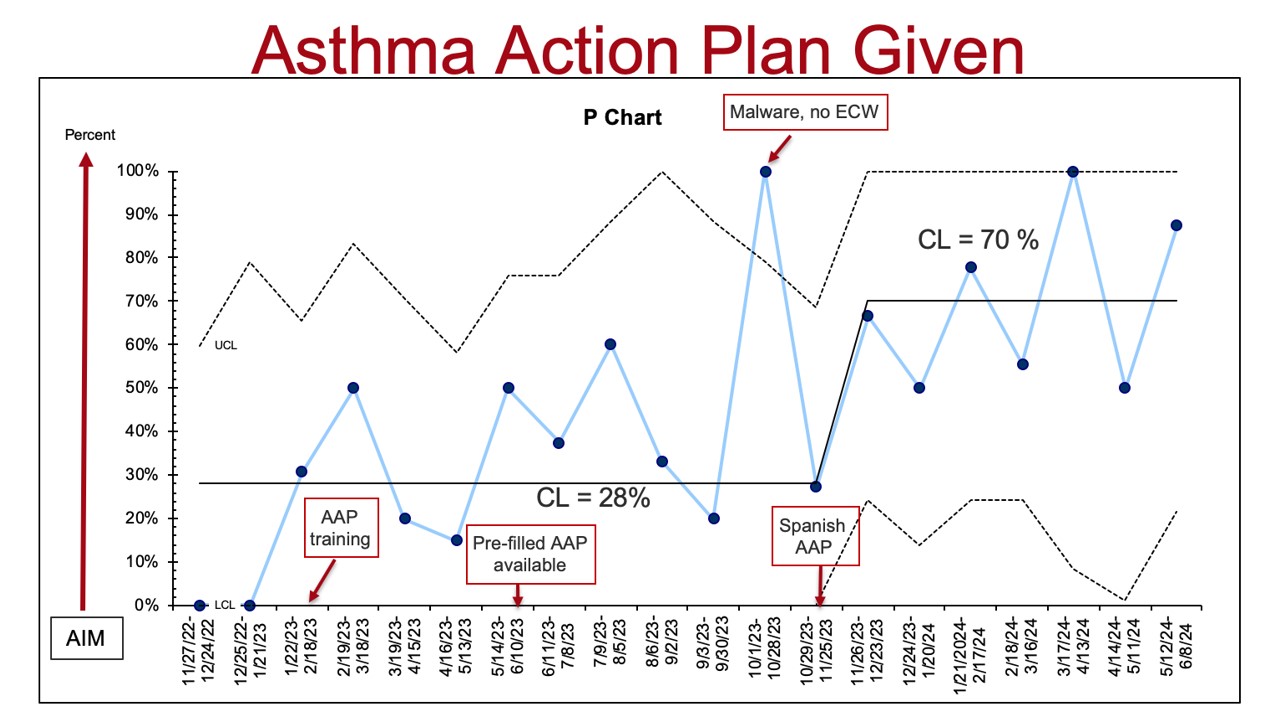 Figure 2. Control chart showing percentage of patients who were given the AAP with center line. Interventions noted in the red boxes. Of note, ECW (eClinicalWorks) is the clinic’s electronic health record system.
 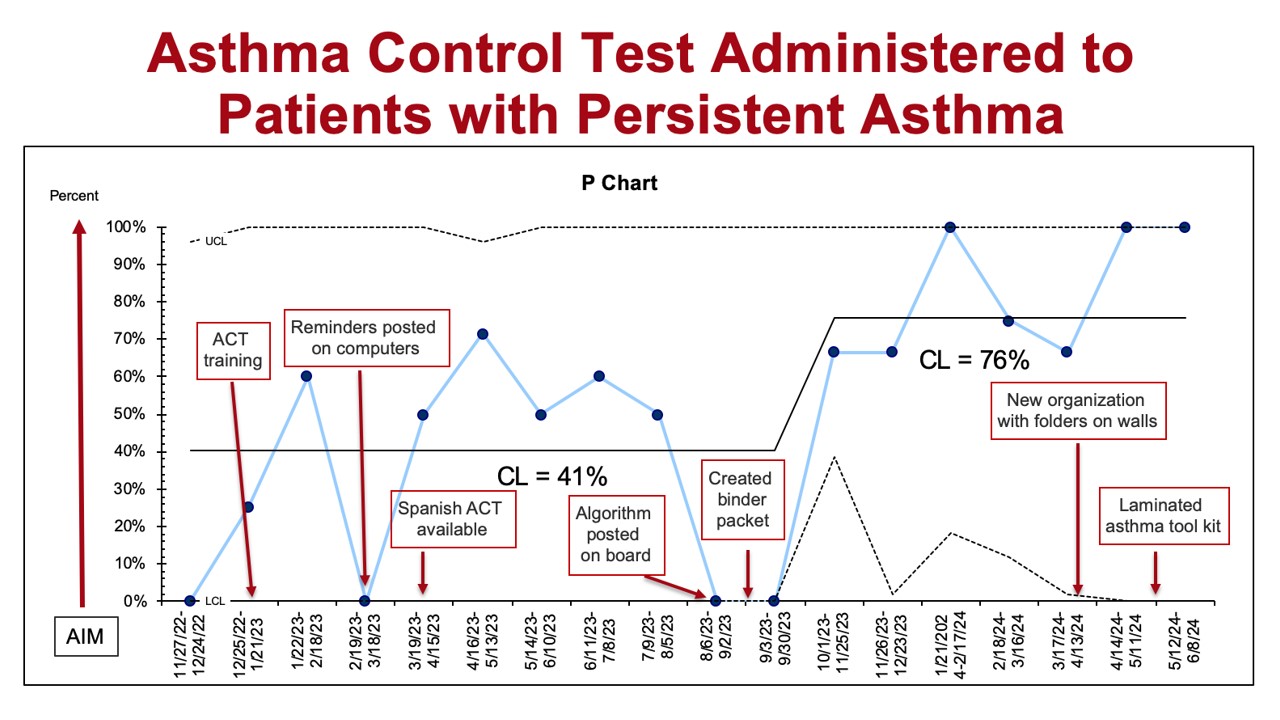 Figure 3. Control chart showing percentage of patients with persistent asthma who were administered the ACT with center line. Interventions noted in the red boxes.