
Emergency Medicine 6
Session: Emergency Medicine 6
 Credit")
 photo")
Joshua A. Saucedo, MD (he/him/his)
Pediatric Emergency Medicine Fellow
Children's Mercy Hospitals and Clinics
Kansas City, Missouri, United States
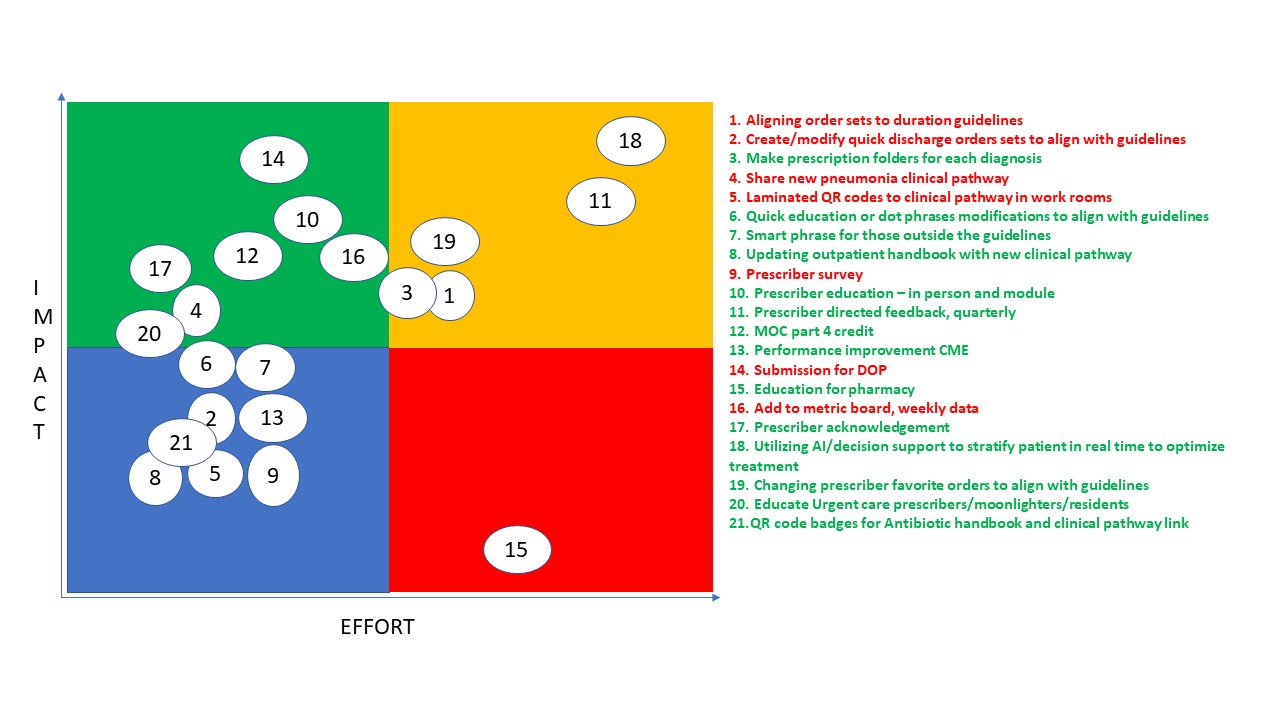 The numbered intervention items on the right correspond to the numbers plotted on the graph to the left. Intervention items highlighted in red have already been completed or are in the process of being completed, items highlighted in green indicate possible future interventions.
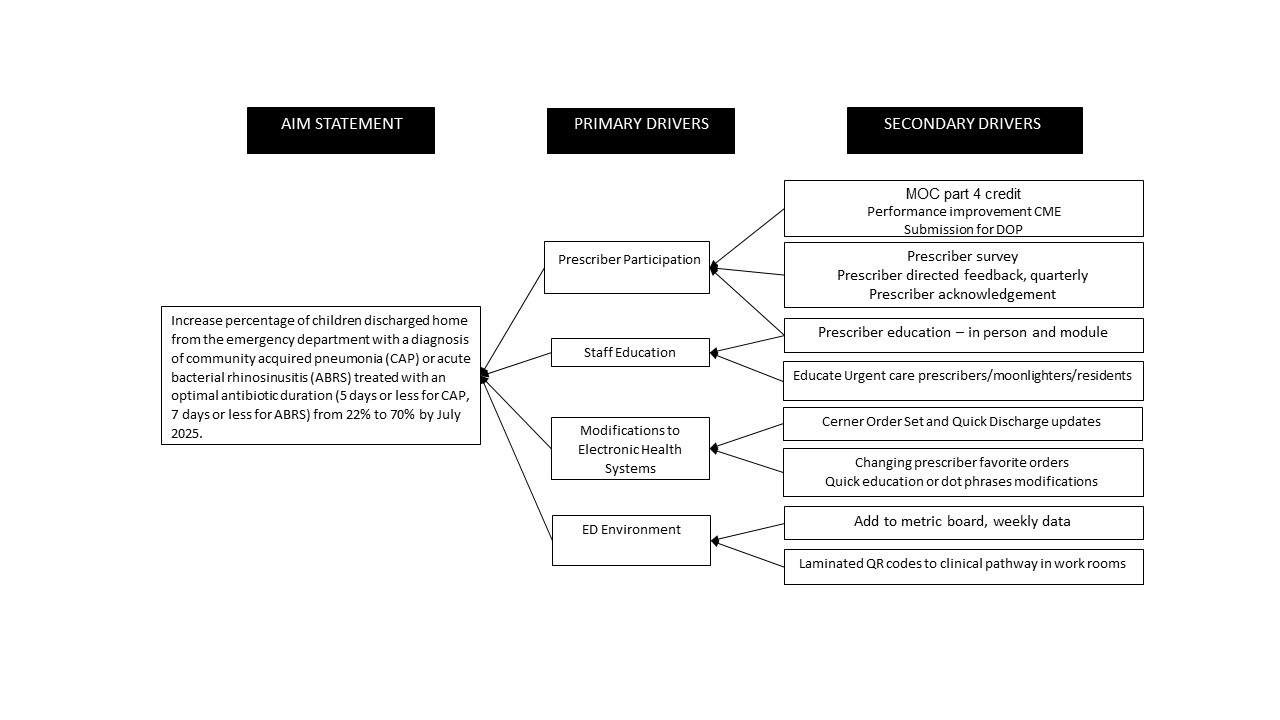
.png) Annotated control charts showing the outcome metric: percentage of children prescribed the suggested duration for CAP and ABRS in the ED; total number (N) of patients included per month.The numbered intervention items on the right correspond to the numbers plotted on the graph to the left. Intervention items highlighted in red have already been completed or are in the process of being completed, items highlighted in green indicate possible future interventions.Annotated control charts showing the outcome metric: percentage of children prescribed the suggested duration for CAP and ABRS in the ED; total number (N) of patients included per month.
Annotated control charts showing the outcome metric: percentage of children prescribed the suggested duration for CAP and ABRS in the ED; total number (N) of patients included per month.The numbered intervention items on the right correspond to the numbers plotted on the graph to the left. Intervention items highlighted in red have already been completed or are in the process of being completed, items highlighted in green indicate possible future interventions.Annotated control charts showing the outcome metric: percentage of children prescribed the suggested duration for CAP and ABRS in the ED; total number (N) of patients included per month.