
Neonatal Nephrology/AKI 1
Session: Neonatal Nephrology/AKI 1
 photo")
Derek M. Gross (he/him/his)
Medical Studenntt
University of Wisconsin School of Medicine and Public Health
Madison, Wisconsin, United States
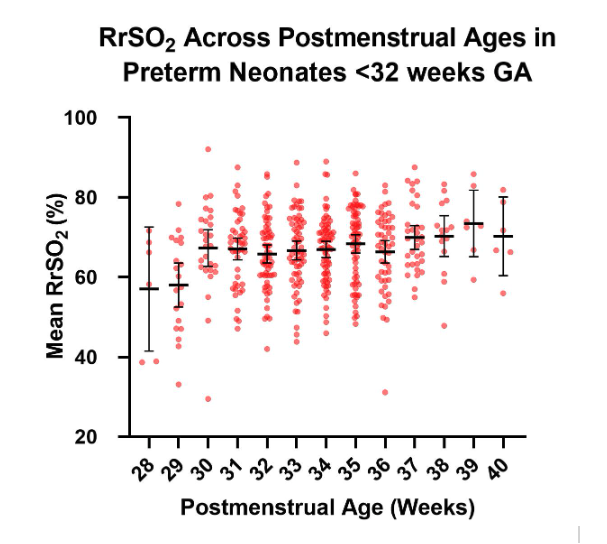 Scatter plot depicting mean RrSO₂ values by PMA. Individual data points represent mean RrSO₂ values for each neonate per PMA week. Shapiro-Wilk testing indicated that the data was not normally distributed; therefore, medians and interquartile ranges (IQR) are overlaid for each PMA to illustrate central tendency and variability in RrSO₂ among the 100 neonates.
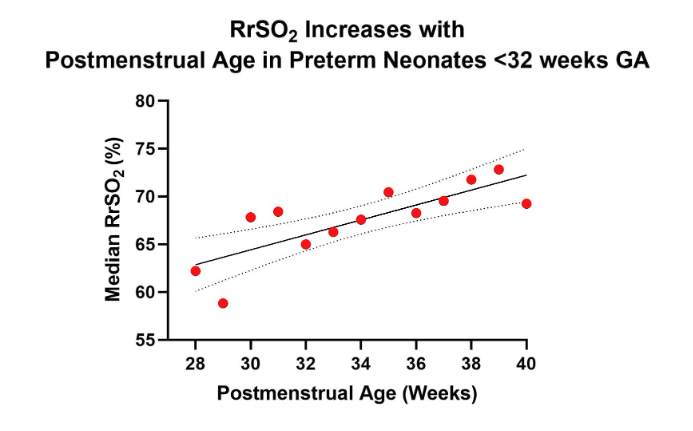 Simple linear regression plot showing the relationship between median RrSO₂ and PMA in weeks. Each data point represents the median RrSO₂ for a given PMA week. There was a positive correlation between median RrSO₂ and PMA (R2 = 0.63, p < 0.01).
.png) Line graph depicting the median RrSO₂ for each PMA in two gestational age (GA) groups, extremely preterm (n = 28) and very preterm (n = 72). There was a positive correlation between RrSO₂ and PMA in the extremely preterm group (R2 = 0.73, p < 0.01; simple linear regression), while the very preterm group did not have a significant correlation (R2 = 0.039 p = 0.54).
Line graph depicting the median RrSO₂ for each PMA in two gestational age (GA) groups, extremely preterm (n = 28) and very preterm (n = 72). There was a positive correlation between RrSO₂ and PMA in the extremely preterm group (R2 = 0.73, p < 0.01; simple linear regression), while the very preterm group did not have a significant correlation (R2 = 0.039 p = 0.54).