Health Services Research 1: Workforce & Underserved Areas
Session: Health Services Research 1: Workforce & Underserved Areas
290 - Geospatial Analyses of Distance and Travel Trends to Pediatric Care in California
Saturday, April 26, 2025
2:30pm - 4:45pm HST
Publication Number: 290.4600
Miriam Ahmad, Valley Children's Healthcare, FRESNO, CA, United States; Tiffany S. Osburn, Valley Children's Healthcare, Madera, CA, United States; Alec M.. Chan-Golston, University of California, Merced, Merced, CA, United States; Sandie Ha, University of California Merced, Merced, CA, United States
- MA
Miriam Ahmad, MD (she/her/hers)
Fellow Physician
Valley Children's Healthcare, California, United States
Presenting Author(s)
Background: Increased regionalization of pediatric care over the last few decades has been an ongoing trend. Closures of local pediatric units, newborn nurseries, and emergency units particularly impacts community and rural sites. Increased travel distance to inpatient and emergency care contributes to healthcare disparities amongst marginalized groups. California has one of the largest populations of children in the country, and there is little published data regarding travel distances, patient characteristics, and hospitalization outcomes related to those travel distances.
Objective: To describe patient characteristics and outcomes associated with travel distance to pediatric care temporally over a decade.
Design/Methods: Data was prepared using the Health Care Access and Information (HCAI) dataset, years 2011-2019 and restricted to California patients ages 0-18 years old. Distance in miles from the zip code of the patient to the hospital which saw the patient was calculated using the centroidal distances of each zip code. An ANOVA was conducted to evaluate significant differences among predictors (for covariates, these were controlled for year). For outcome length of stay (LOS), a hierarchical linear regression predicting LOS was fit to evaluate its association with distance controlling for year, accounting for clustering within zip code.
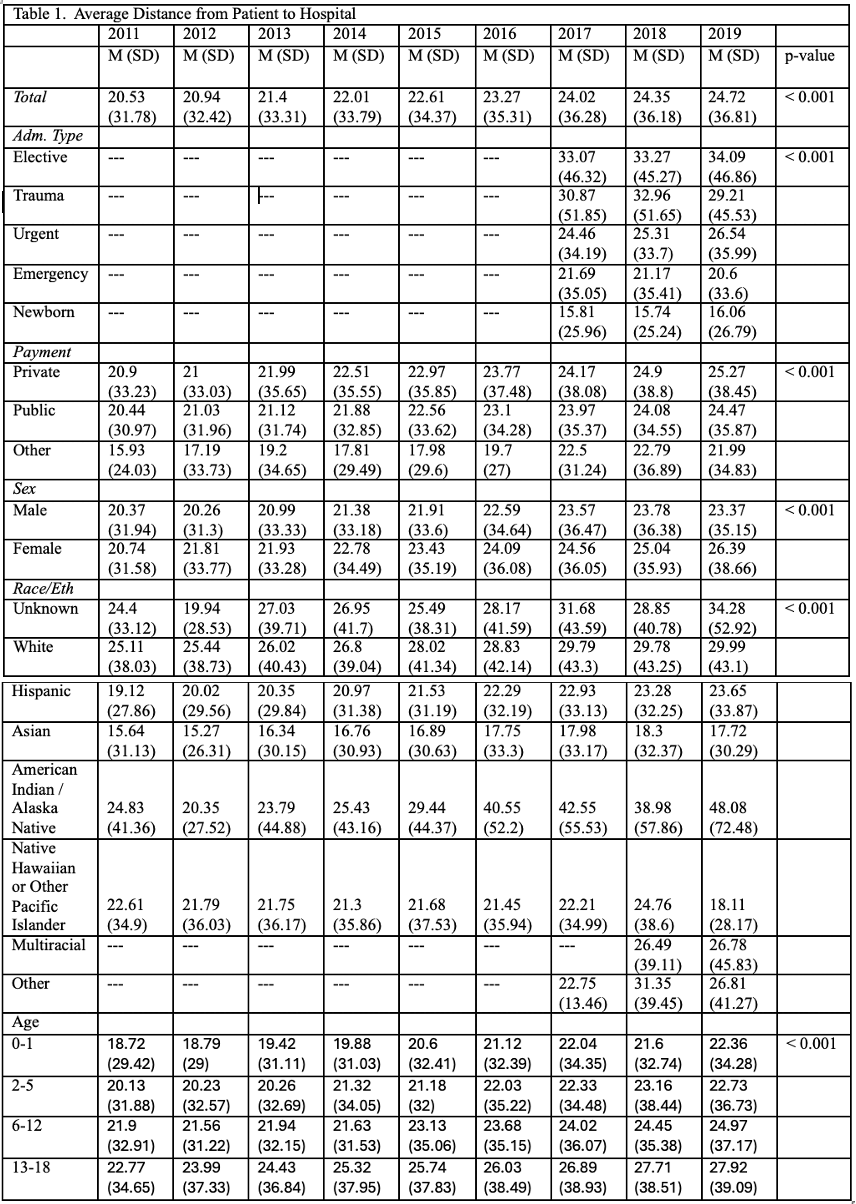
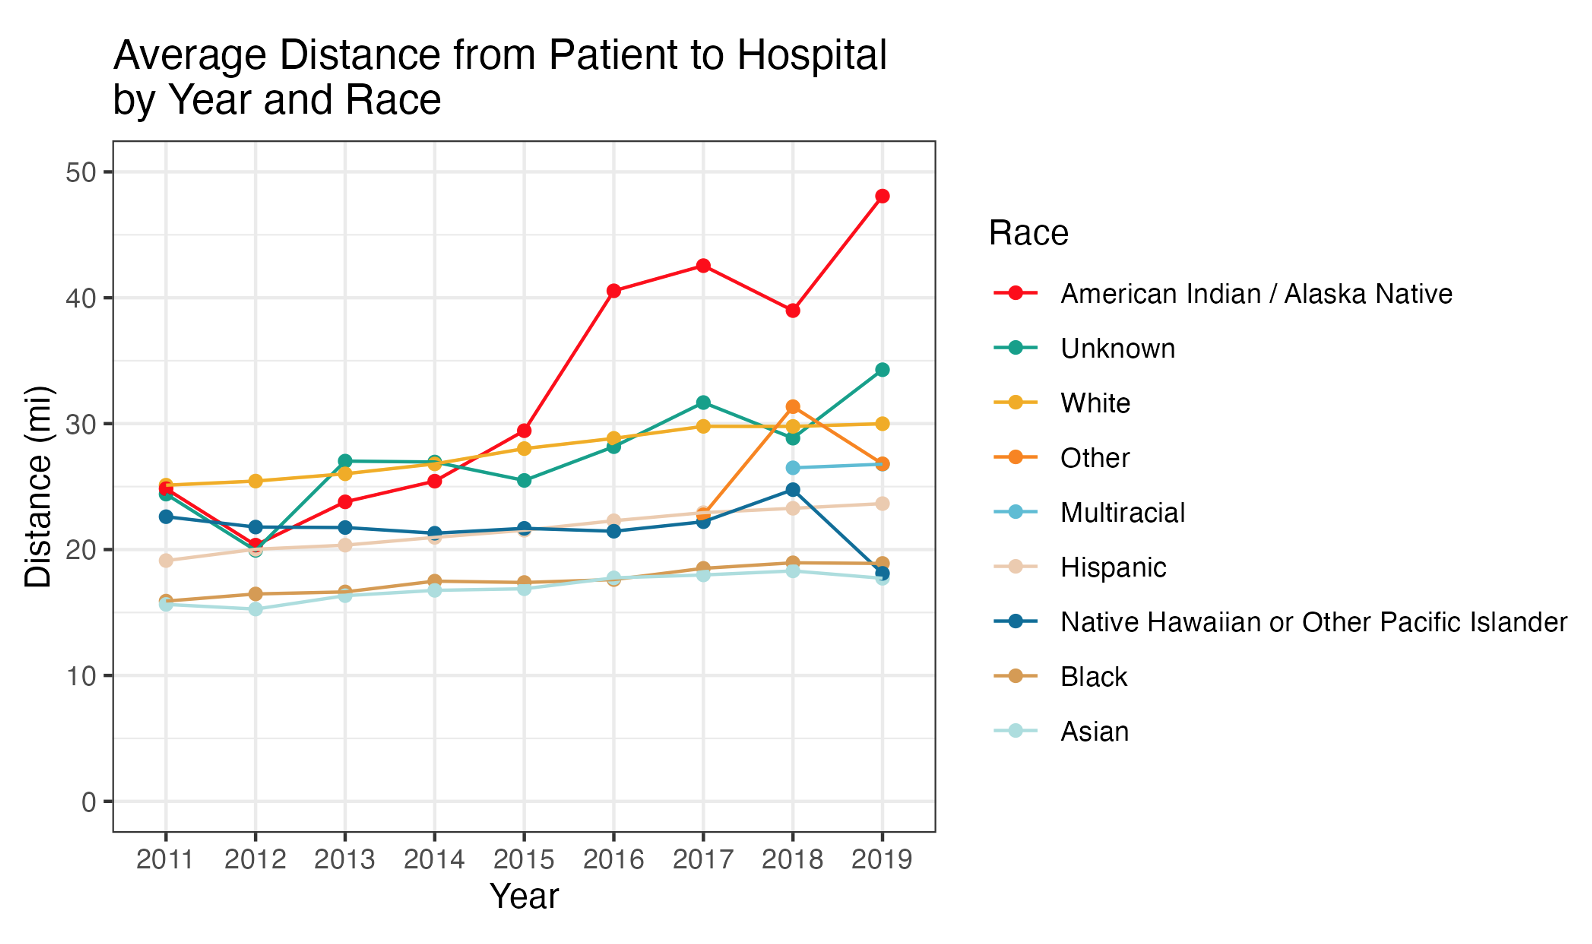
Results: Mean travel distance for all pediatric care in California rose from 20.53 miles in 2011 to 24.72 miles in 2019, marking a 20% increase (p < 0.001). Notably, certain zip codes experienced much longer journeys, highlighting disparities in access to care. (Figure 1). This trend was consistent with a mileage increase for all the covariates: insurance payor status, gender, and age (p < 0.001 for all) (Table 1). Children accessing newborn and emergency care traveled less miles than those seeking elective, urgent, or trauma care. Racial differences were most profound amongst American Indian/Alaska Natives with a mean increase of 23.25 miles (Figure 2). For outcome LOS, for every 33 miles traveled an increased LOS of 1 day was expected (p < 0.001).
Conclusion(s): Distances traveled to pediatric care in California are increasing. While the number of miles may not seem substantial, they are meaningful for critically ill children or those with limited resources. Our analysis also found discrepancies in travel distances by race which deserves further investigation. If these trends continue, they could adversely impact healthcare outcomes for children in California. We plan to conduct further analyses focusing specifically on pediatric inpatient access and outcomes.
Average Distance in Miles Traveled in 2019
.png) Average distances traveled in 2019 mapped to a zip code map of California (from the 2020 census).
Average distances traveled in 2019 mapped to a zip code map of California (from the 2020 census).Average Distance from Patient to Hospital

Average Distance from Patient to Hospital by Year and Race

Average Distance in Miles Traveled in 2019
.png) Average distances traveled in 2019 mapped to a zip code map of California (from the 2020 census).
Average distances traveled in 2019 mapped to a zip code map of California (from the 2020 census).Average Distance from Patient to Hospital

Average Distance from Patient to Hospital by Year and Race


