
Neonatal General 7: Epidemiology, Outcomes and Periviability
Session: Neonatal General 7: Epidemiology, Outcomes and Periviability

Kulsajan S. Bhatia, MD
Neonatal Perinatal Fellow
University of Alabama School of Medicine
Bimringham, Alabama, United States
.png) Baseline characteristics for outcome groups
Baseline characteristics for outcome groups.png) This plot shows the relationship between gestational age (in weeks) and the predicted probability of death and/or neuro-morbidity, separated by multiparity status. The x-axis represents gestational age, ranging from 21 to 27 weeks, and the y-axis indicates the probability of death. The blue line represents single births ("Multiparity: No"), while the red line represents twin births ("Multiparity: Yes").
This plot shows the relationship between gestational age (in weeks) and the predicted probability of death and/or neuro-morbidity, separated by multiparity status. The x-axis represents gestational age, ranging from 21 to 27 weeks, and the y-axis indicates the probability of death. The blue line represents single births ("Multiparity: No"), while the red line represents twin births ("Multiparity: Yes").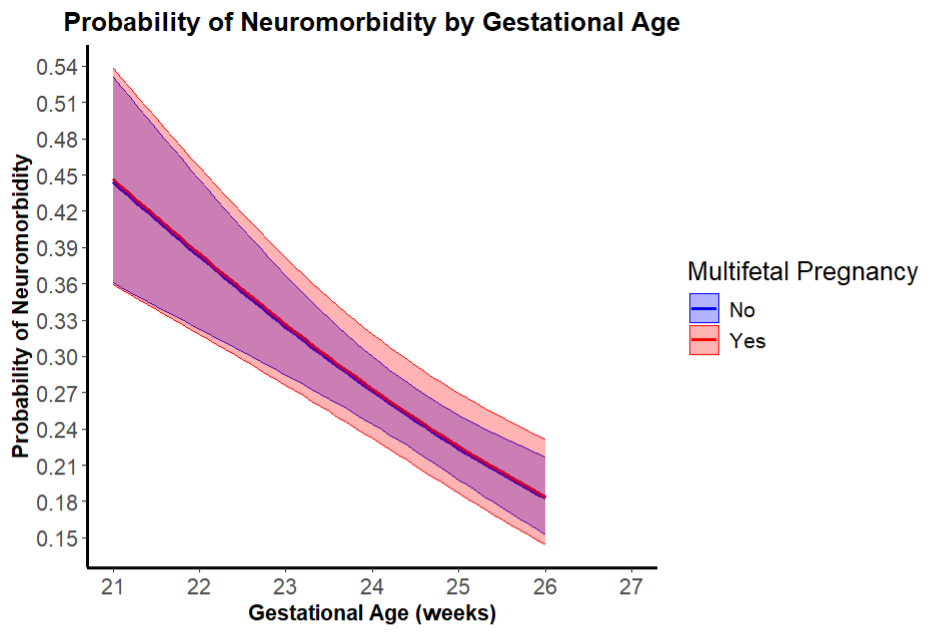 Spline representation of neuro-morbidity showing relationship between singleton vs multiparity.