584 - Use of Fourier transformation of monitoring waveforms to automate movement detection in sedated patients
Sunday, April 27, 2025
8:30am – 10:45am HST
Publication Number: 584.6951
Franklin Ducatez, Boston Children's Hospital, Boston, MA, United States; Taylor Smith, Boston Children's Hospital/Harvard Medical School, Cambridge, MA, United States; John Kheir, Boston Children's Hospital, Boston, MA, United States
Post-Doc Boston Children's Hospital Boston, Massachusetts, United States
Background: Sedation and analgesia are essential to the care of critically ill infants and children. However, sedative agents also carry significant risks, and thus best practices focus on titrating sedation to the minimum dose required to maintain comfort. The quantification of sedation level remains a critical task in sedation provision. Current practice is for bedside staff to perform intermittent, active assessments of sedation level according to standardized scales. However, these methods are time-intensive, intermittent, and subjective. Establishing a continuously measured, objective metric of sedation level may improve the rigor of sedation assessments, and advance the science of sedation practices in infants and children. Objective: The purpose of this work was to quantify patient movement using artifact in photoplethysmograph (PPG) readings in sedated patients. Design/Methods: A convenience sample of continuous PPG waveform data collected over a 3 days period were losslessly collected from a single institution. Waveform elements were streamed (Apache Kafka) then stored in raw format within a time series database (Clickhouse). In total, data represented 844 hours of monitoring in 39 patients. Waveforms were divided into 10 second increments on which discrete Fourier transformation (FT) was performed. This approach summarizes cyclical (repeating) data as an accumulation of component waveforms of discrete frequencies and amplitudes. The resulting frequency matrix was then filtered and normalized. For each 10 second increment, the maximum amplitude of the FT-data was identified and used to normalize the entire FT signature. Thereafter, we computed the sum of all FT-amplitudes across the filtered spectrum from 0 to 10 Hz. This resulted in the computation of a single number between 0 and 25 that represented the degree of motion artifact within a 10 second sample, with 0 being perfectly still (i.e. no artifact present) and 25 being nearly all artifact motion artifact. Results: Processing time for all 844 hours was < 12 minutes on a personal computer. Raw waveforms (Figure 1A, top) underwent Fourier transformation (Figure 1A, middle), then summarized as a single numerical value assigned to the 10-second sample (Figure 1A, bottom). Analysis and visualization of all 10-second epochs together allowed for a potential visualization of patient movement over time (Figure 1B).
Conclusion(s): FT of raw waveforms may be useful to quantify patient movement. Validation of these methods against human interpretations of waveform artifact, then of patient motion, are critical next steps.
Automated Motion Level Assessment Workflow 
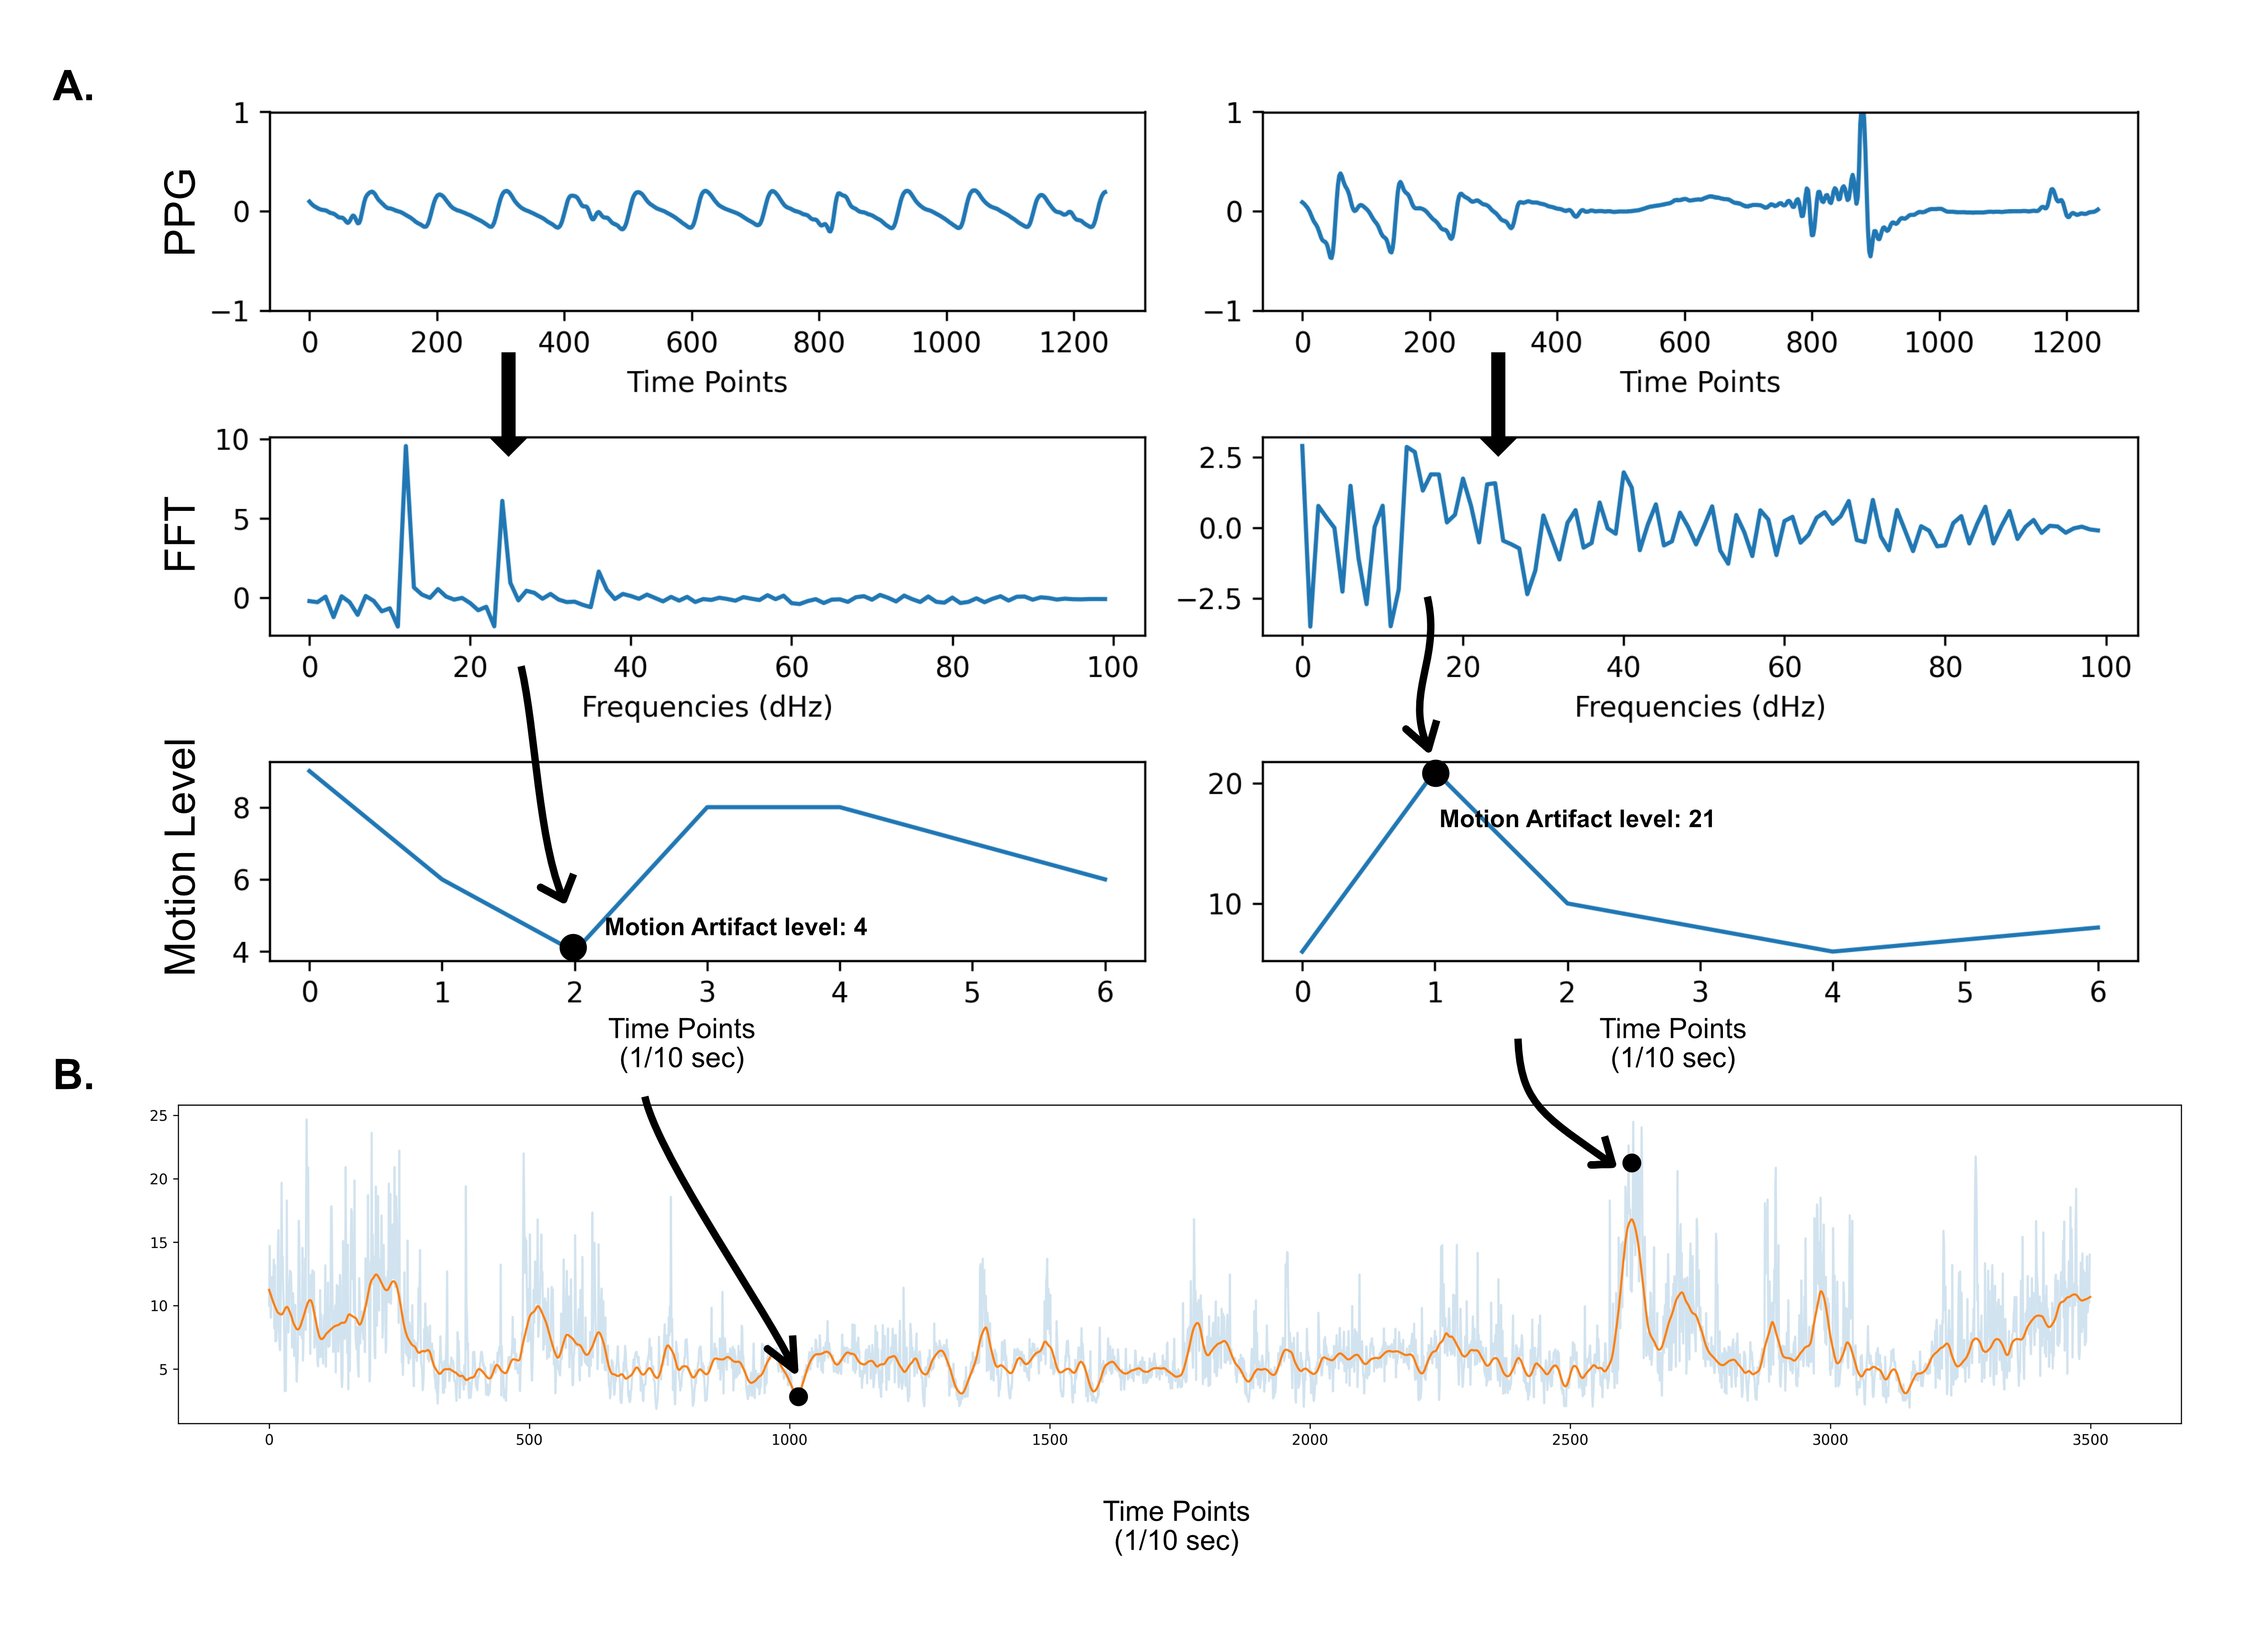
(A) Raw data from PPG are divided in 10 sec increments, then discrete Fourier transformation was performed. After normalisation and filtering, motion artifact level can be computed. (B) Evolution of this new metric accross a longer timespan (here 10h).