
Neonatal Infectious Diseases/Immunology 4: Immunity in early life
Session: Neonatal Infectious Diseases/Immunology 4: Immunity in early life
 photo")
Jonathan Knowlton, MD PhD (he/him/his)
Neonatology Fellow
Childrens Hospital of Philadelphia
PHILADELPHIA, Pennsylvania, United States
.png) A) Weight change as a percentage of birth weight for individual mice inoculated with either PBS (mock; black lines) or 0.1 TCID50 of influenza virus (red lines). B) Kaplan-Meier survival curves for neonatal mice inoculated with either PBS (mock) or the indicated TCID50 of influenza virus.
A) Weight change as a percentage of birth weight for individual mice inoculated with either PBS (mock; black lines) or 0.1 TCID50 of influenza virus (red lines). B) Kaplan-Meier survival curves for neonatal mice inoculated with either PBS (mock) or the indicated TCID50 of influenza virus. .png) Continuous pulse oximetry (30 sec) of mice seven days post-inoculation with either PBS (mock; n = 3; shades of orange) or 0.1 TCID50 of influenza virus (n = 3; shade of blue).
Continuous pulse oximetry (30 sec) of mice seven days post-inoculation with either PBS (mock; n = 3; shades of orange) or 0.1 TCID50 of influenza virus (n = 3; shade of blue).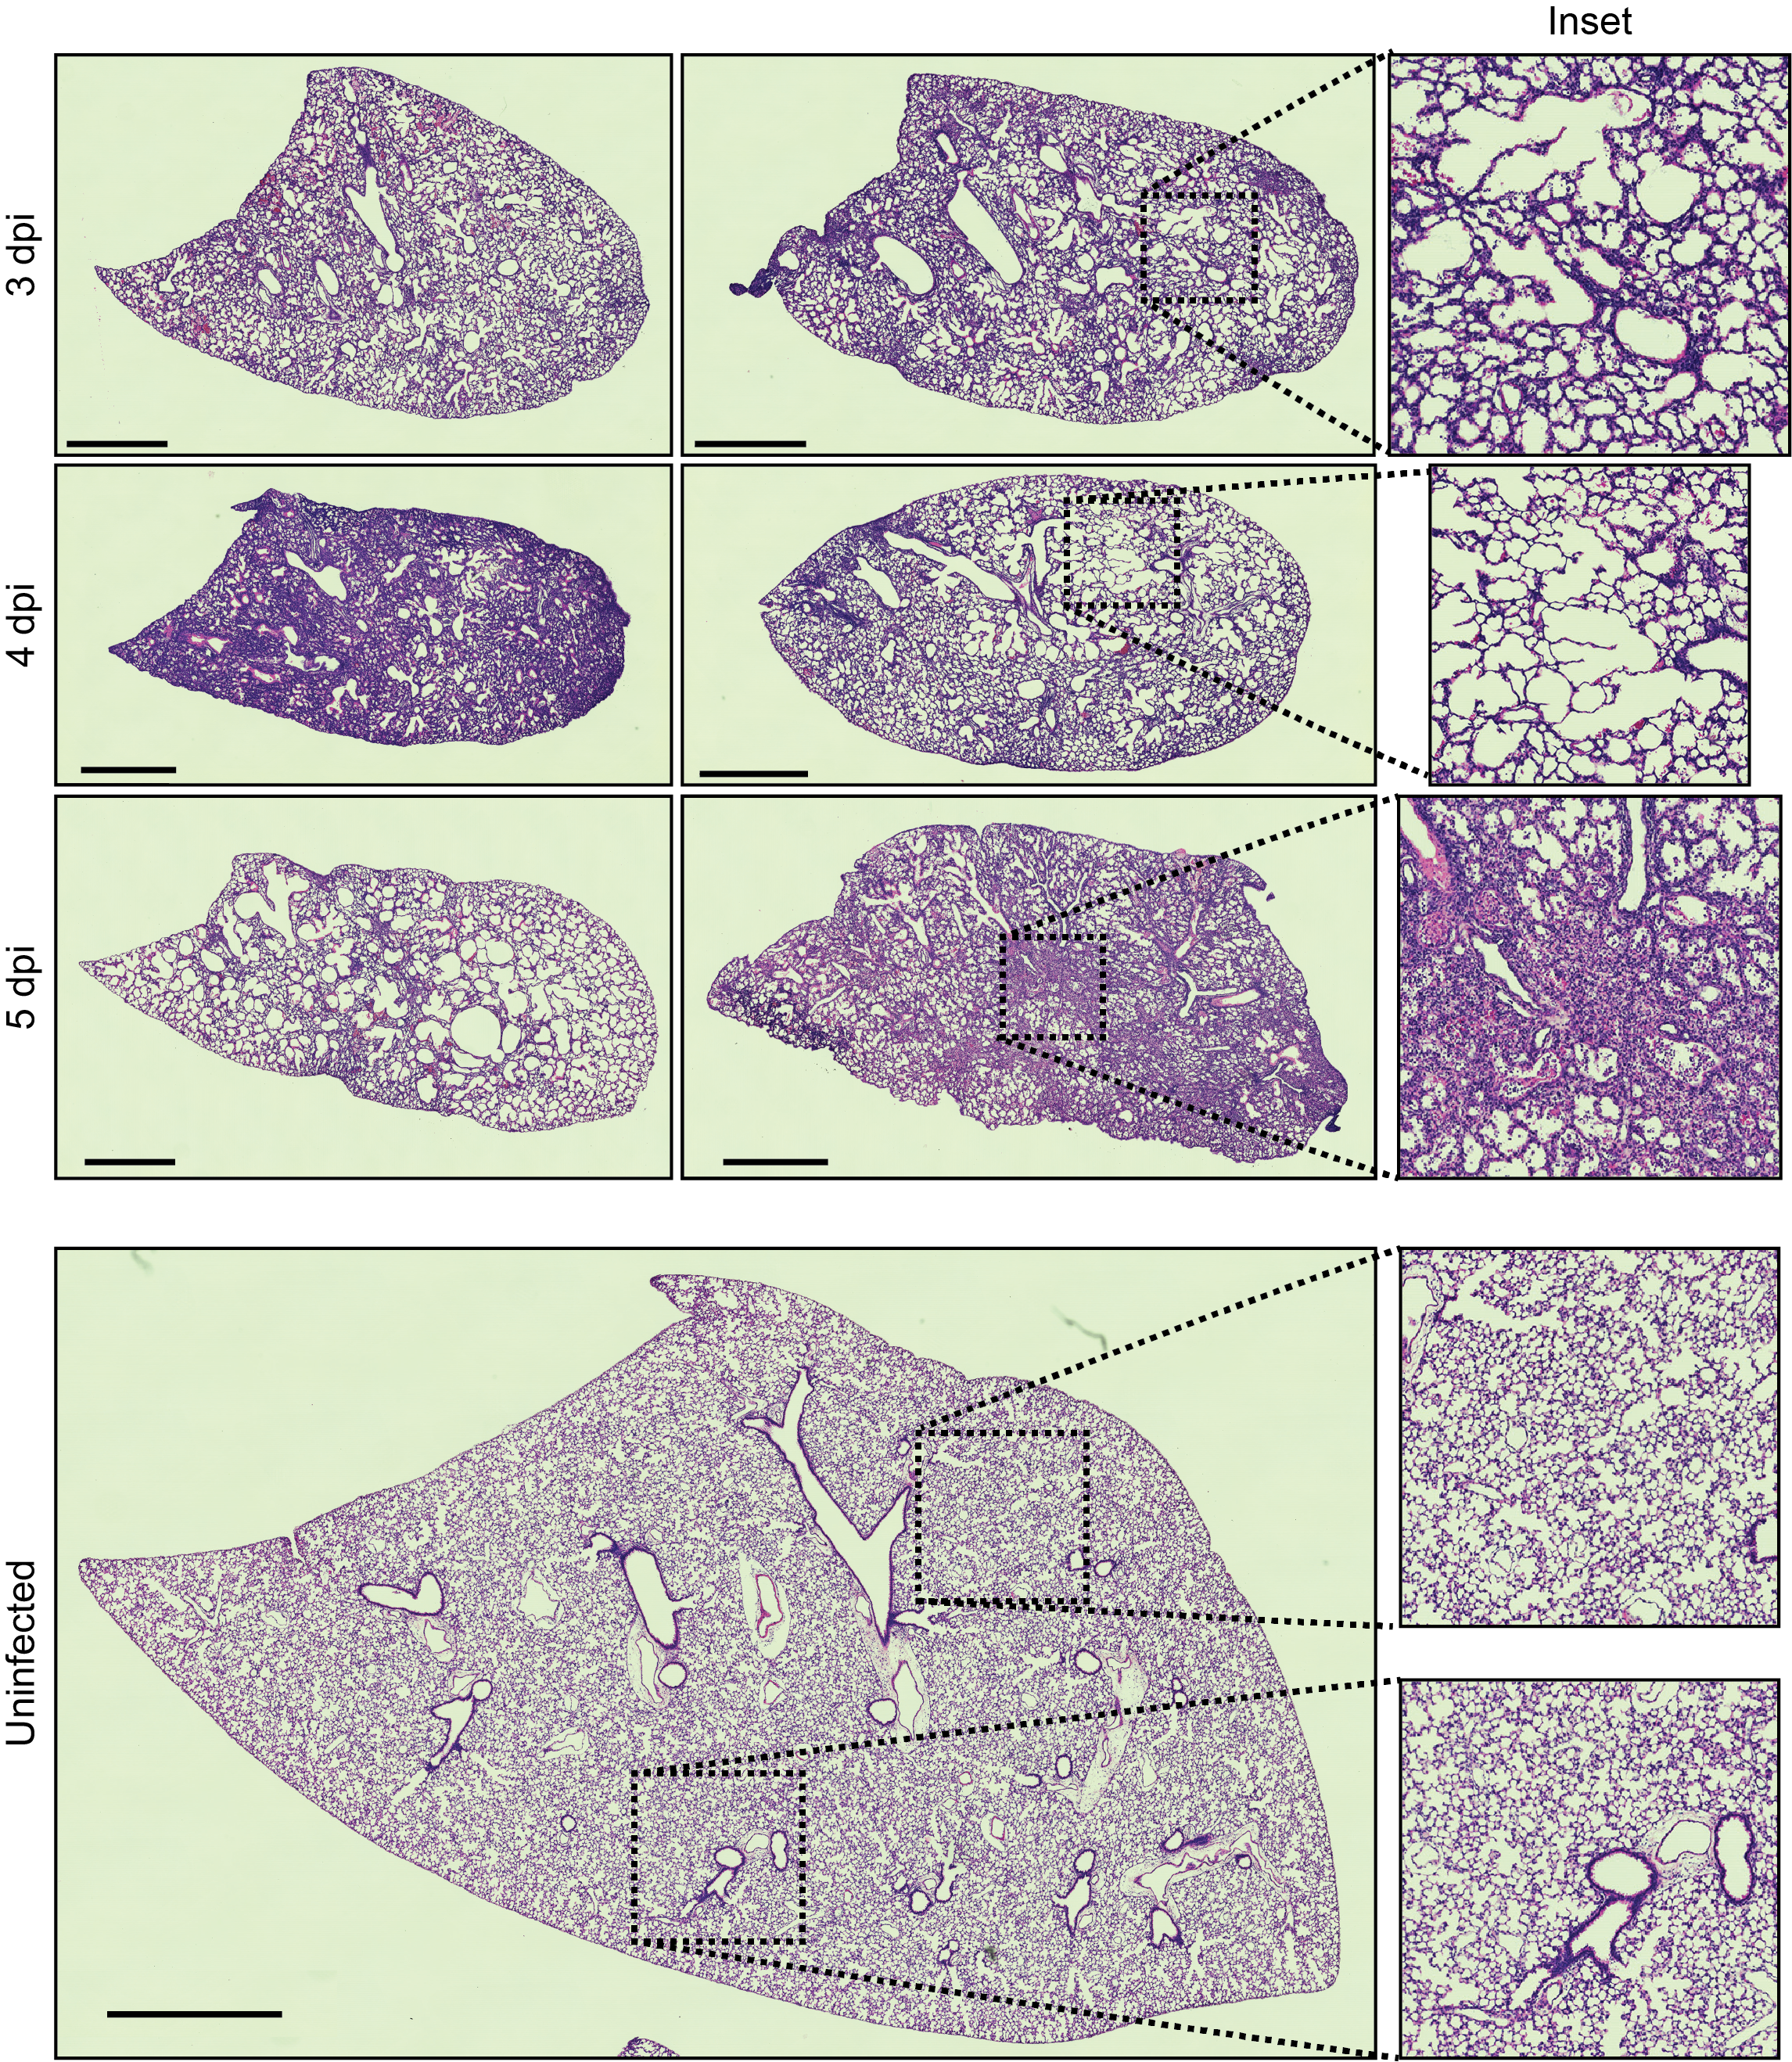 H&E staining of lung sections harvested from neonatal mice at 3-5 dpi (top three rows) or from a control uninfected mouse (bottom row) 14 days post sham (PBS) inoculation. Each H&E section is from a different mouse. Insets on the far right are magnified views representing one square millimeter of tissue area. All scale bars correspond to 1mm. A) Weight change as a percentage of birth weight for individual mice inoculated with either PBS (mock; black lines) or 0.1 TCID50 of influenza virus (red lines). B) Kaplan-Meier survival curves for neonatal mice inoculated with either PBS (mock) or the indicated TCID50 of influenza virus. Continuous pulse oximetry (30 sec) of mice seven days post-inoculation with either PBS (mock; n = 3; shades of orange) or 0.1 TCID50 of influenza virus (n = 3; shade of blue).H&E staining of lung sections harvested from neonatal mice at 3-5 dpi (top three rows) or from a control uninfected mouse (bottom row) 14 days post sham (PBS) inoculation. Each H&E section is from a different mouse. Insets on the far right are magnified views representing one square millimeter of tissue area. All scale bars correspond to 1mm.