410 - Association Between Gun Law Strength and Pediatric Mortality
Sunday, April 27, 2025
8:30am – 10:45am HST
Publication Number: 410.3862
Kelsey Gastineau, Vanderbilt University Medical Center, Nashville, TN, United States; Annie Andrews, Cincinnati Children's Hospital Medical Center, Mount Pleasant, SC, United States; Kavita Parikh, Children's National Health System, Washington DC, DC, United States; James W. Antoon, Vanderbilt University Medical Center, Nashville, TN, United States; Alison R. Carroll, Monroe Carell Jr. Children's Hospital at Vanderbilt, Nashville, TN, United States; David P. Johnson, Monroe Carell Jr. Children's Hospital at Vanderbilt, Nashville, TN, United States; Ankita T. Gupta, Monroe Carell Jr. Children's Hospital at Vanderbilt, Nashville, TN, United States; Matthew Hall, Children's Hospital Association, Lenexa, KS, United States; Krista R. Mehari, Vanderbilt University, Peabody College, Dept of Psych and Human Devt, Nashville, TN, United States
Assistant Professor Vanderbilt University Medical Center Nashville, Tennessee, United States
Background: Pediatric firearm mortality remains a critical public health issue in the United States. Variations in firearm legislation across states may contribute to differences in firearm mortality rates among youth. Objective: Examine the association between gun law strength and pediatric firearm mortality rates. Design/Methods: We conducted a cross-sectional analysis of pediatric (aged 0-21) firearm mortality rates from 2015-2022 across U.S. states, utilizing the Giffords Score Card as an index of firearm law strength. The Giffords Score Card is a state-by-state rating system that evaluates the strength of firearm laws across the U.S., assigning letter grades (A to F) based on the comprehensiveness of each state’s firearm regulations where a better grade (i.e., an A vs a C) reflects an increase in law strength. Firearm law categories include background checks, firearm dealer regulations, domestic violence protections, gun owner accountability, firearm trafficking, and assault weapons restrictions. The primary outcome was state-level pediatric firearm mortality rate using 2015-2022 Web-based Injury Statistics Query and Reporting System data. We used a Negative Binomial generalized estimating equation (GEE) with repeated state-level measurements to analyze the impact of firearm law strength (letter grade converted to grade point) and year on count-based outcomes, accounting for within-state correlations over time. Rate ratios (RR) were calculated to quantify the association between grade point and pediatric mortality rates. Results: There were 45,716 youth that died due to a firearm injury from 2015-2022. Firearm mortality rates were highest for youth aged 18-21, males, assault intent, and youth living in the South region (Table 1). Pediatric firearm mortality rates increased from 2015 (4.98 per 100,000 youth) to 2022 (7.55 per 100,000 youth), with a peak in 2021 (7.99 per 100,000 youth). For each one-point increase in a state’s gun law grade, we observed a 16.9% decrease in the pediatric firearm mortality rate (RR 0.831, 95% CI 0.765–0.92; Figure 1).
Conclusion(s): More stringent state firearm-related laws were significantly associated with decreased pediatric firearm fatality rates in youth. This association offers support for the potential protective effect of comprehensive firearm legislation. These results also underscore the potential impact of state-level legislative measures in reducing firearm-related mortality among youth and suggest that passing stronger firearm laws may be a key public health strategy for protecting youth and, in turn, reduce pediatric firearm mortality rates.
Table 1: Characteristics of Study Population, 2015–2022 (N=45,716) 
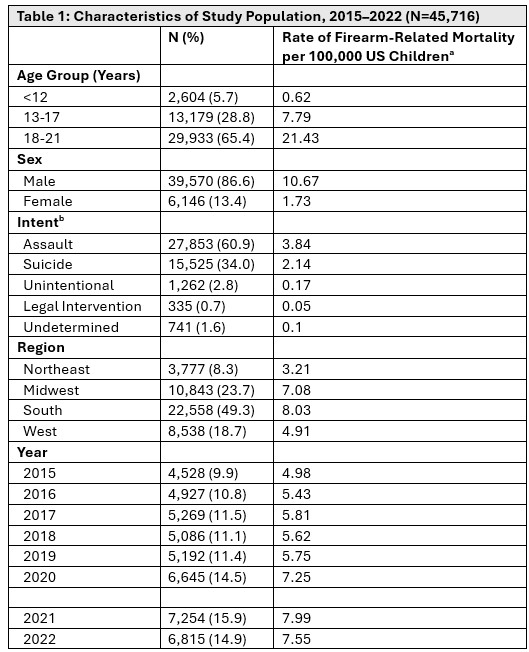
aMortality rate is defined as the number of deaths per 100,000 population using Fatal Injury Data in Web-based Injury Statistics Query and Reporting System (WISQARS) bIntent is categorized using 10th revision of the International Classification of Diseases codes
Figure 1: Gun law score and pediatric firearm-related mortality rates, 2015-2022 The x-axis represents state firearm law strength on a grade point scale from 0-4 where 0 corresponds to an “F” rating and 4 to an “A” rating based on the Giffords Score Card. Each increase in grade point reflects a strengthening of firearms laws.