
Obesity 2
Session: Obesity 2
 photo")
Sabrina Salman (she/her/hers)
Student
University of Connecticut School of Medicine
Lexington, Massachusetts, United States
.png) Table 1. Male and Female adolescent obesity rates in 2017 (pre-pandemic) vs 2021 (post-pandemic) per demographic group in Black or African American, Hispanic, White, and All Races (national average) with following P-values showing statistical significance in all groups except BOAA males and White females
Table 1. Male and Female adolescent obesity rates in 2017 (pre-pandemic) vs 2021 (post-pandemic) per demographic group in Black or African American, Hispanic, White, and All Races (national average) with following P-values showing statistical significance in all groups except BOAA males and White females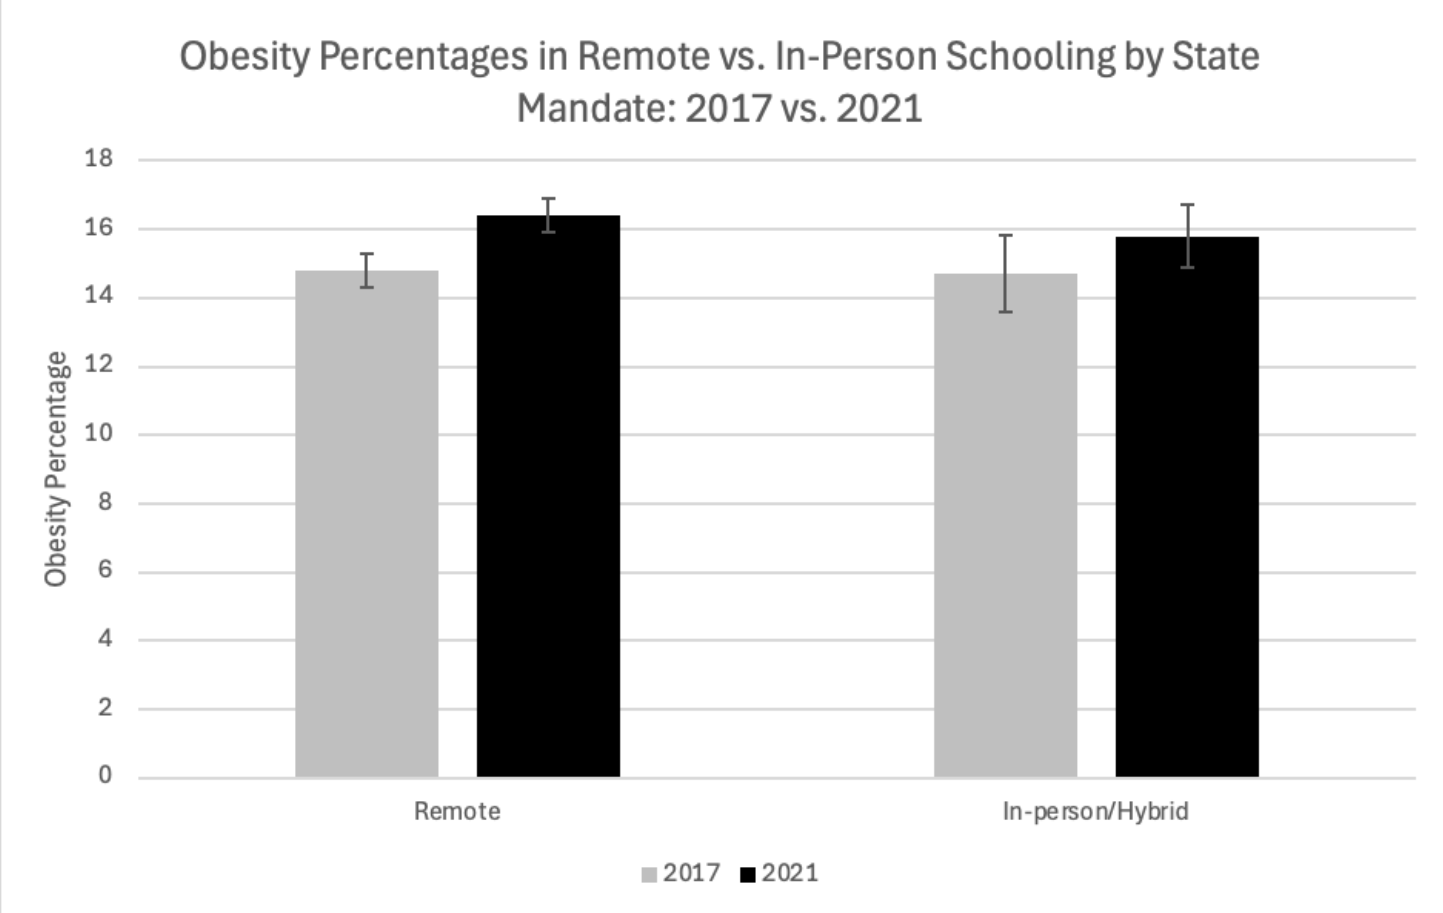 Figure 1. Obesity percentages out of national population for states under remote learning requirements vs those in in-person/hybrid requirements during the pandemic in between 2017 and 2021.
 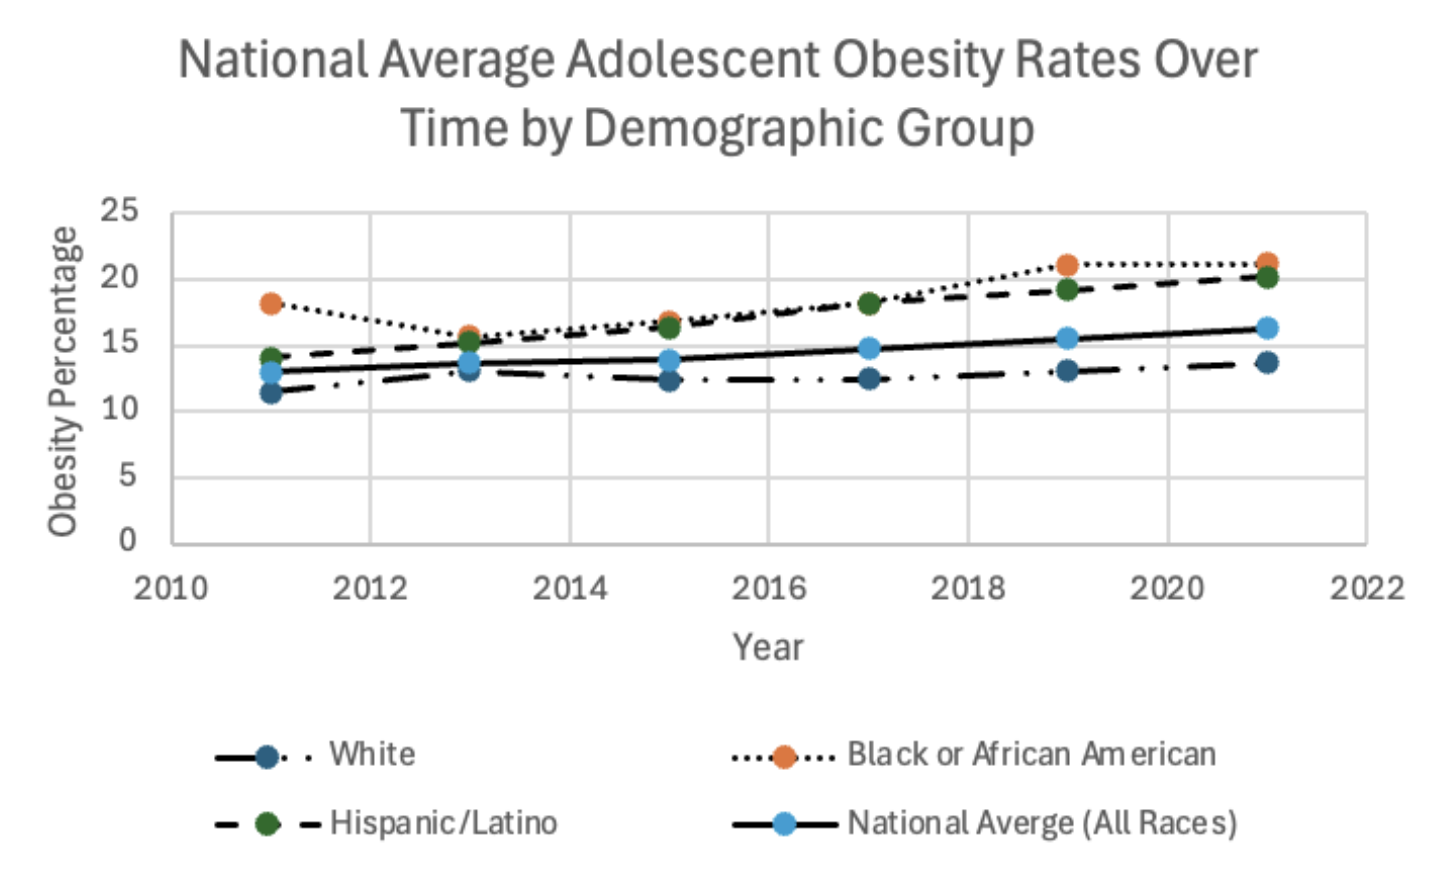 Figure 2. National averages per demographic groups and national average from 2011-2021, with Hispanic and BOAA populations surpassing the national average with an increased rate of 1.09 increase in obesity per year in BOAA and 1.21 increase in Hispanic compared to the national average rate of 0.65 and White populations with an increase rate of 0.32 obesity increase per year.