
Gastroenterology/Hepatology
Session: Gastroenterology/Hepatology

Jennifer M. Schuh, MD
Research Resident
Medical College of Wisconsin
Milwaukee, Wisconsin, United States
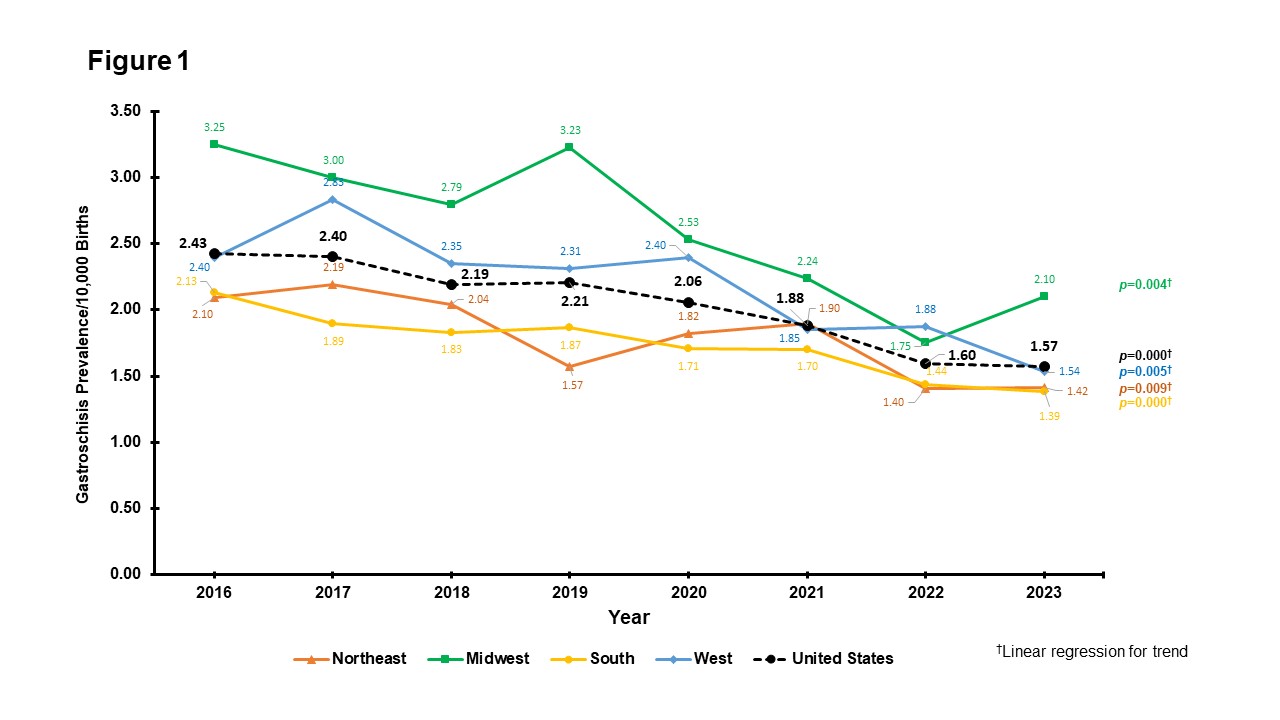 Linear regression coefficient (95% CI) for the decrease in gastroschisis prevalence: Northeast(NE), -1.1 (-1.17 - -0.04), p=0.009; Midwest(MW), -0.20 (-0.30 - -0.09), p=0.004; South(S), -0.10 (-0.12 - -0.07), p=0.000; West(W), -0.15 (0.23 - -0.06), p=0.005; and Nationwide(U.S.), -0.13 (-0.16 - -0.10), p=0.000.
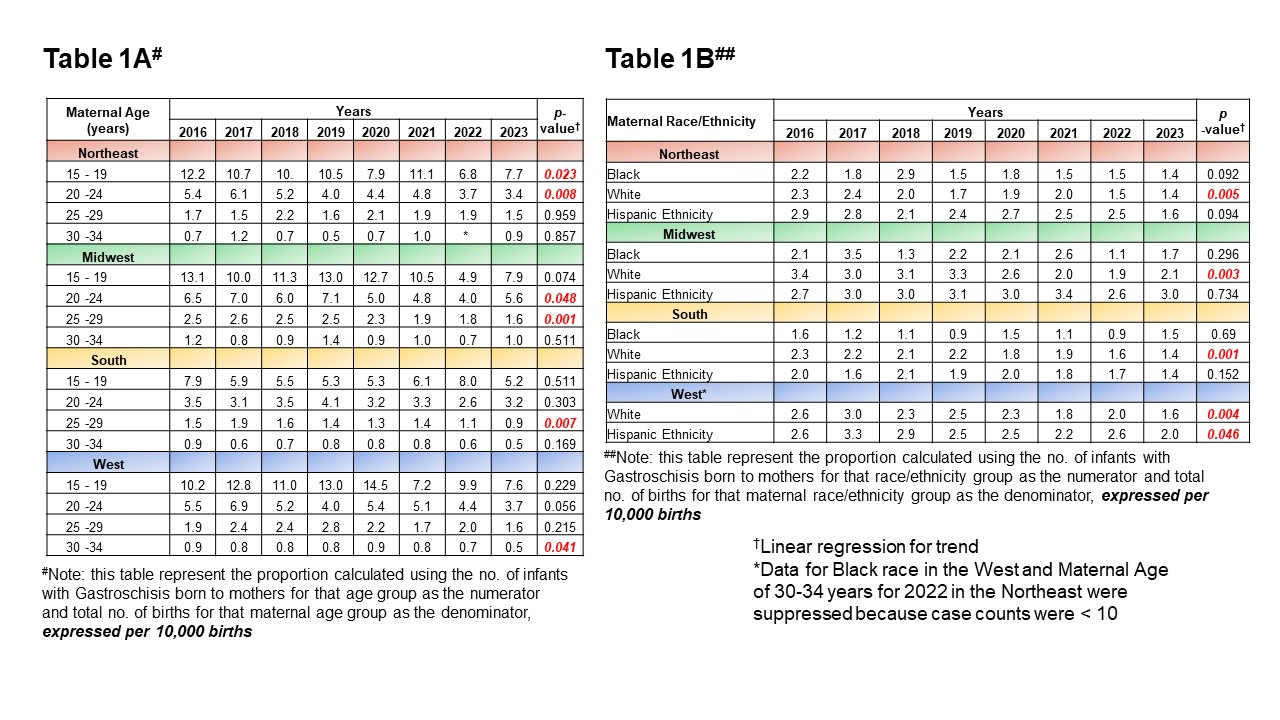 Table 1A. In the eight-year analysis, the Northeast(NE) showed a significant decrease in the proportion of gastroschisis infants among mothers aged 15-19 (p=0.023) and 20-24 (p=0.008), the Midwest(MW) among mothers aged 20-24 (p=0.048) and 25-29 (p=0.001), the South(S) among mothers aged 25-29 (p=0.007), and West(W) among mothers aged 30-34 (p=0.041). Table 1B. In the eight-year analysis, all four census regions demonstrated a significant decrease in the proportion of gastroschisis infants among the White maternal population [Northeast(NE), p=0.005; Midwest(MW), p=0.003); South(S), p=0.001, and West(W), p=0.004]. Additionally, a significant decrease was observed in the proportion of gastroschisis infants born to the Hispanic maternal population in the West(W, p=0.046).
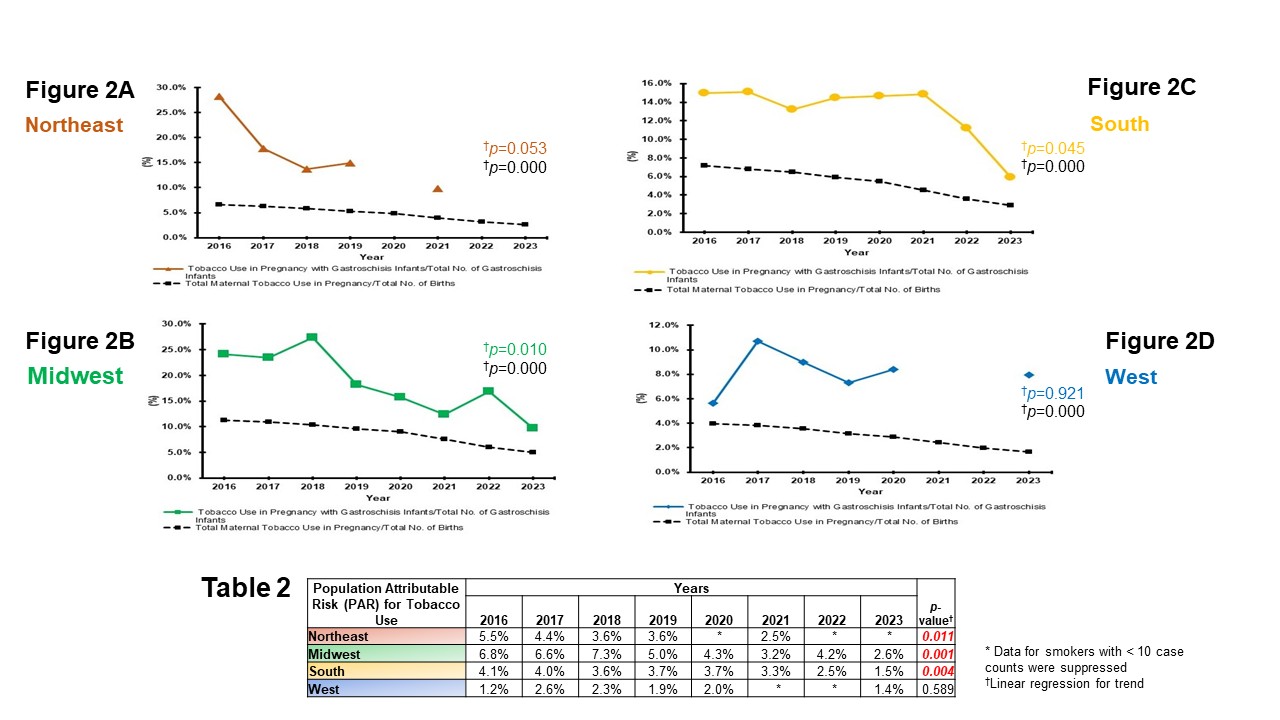 Figures 2A-2D: Each figure depicts trends in the proportion of maternal tobacco use during pregnancy in the context of Gastroschisis (proportion of tobacco use during pregnancy with gastroschisis infants/total number of gastroschisis infants) and the overall maternal tobacco use in pregnancy (proportion of total maternal tobacco use in pregnancy/total number of births) across the four U.S. Census regions. The proportion of overall maternal tobacco use showed a decreasing trend in all four regions, while the proportion specific to gastroschisis infants decreased only in the Midwest(MW), p=0.010 and South(S), p=0.045. Table 2: This table shows the eight-year trends in the Population Attributable Risk (PAR) of maternal tobacco use during pregnancy in relation to Gastroschisis across the four US census regions. The PAR showed a decreasing trend in the Northeast(NE, p=0.011), Midwest(MW, p=0.001), and South(S, p=0.004), while no significant decrease seen in the West(W).