
Neonatal Infectious Diseases/Immunology 4: Immunity in early life
Session: Neonatal Infectious Diseases/Immunology 4: Immunity in early life
 photo")
Asimenia Angelidou, MD PhD (she/her/hers)
Assistant Professor in Pediatrics
Harvard Medical School
Boston, Massachusetts, United States
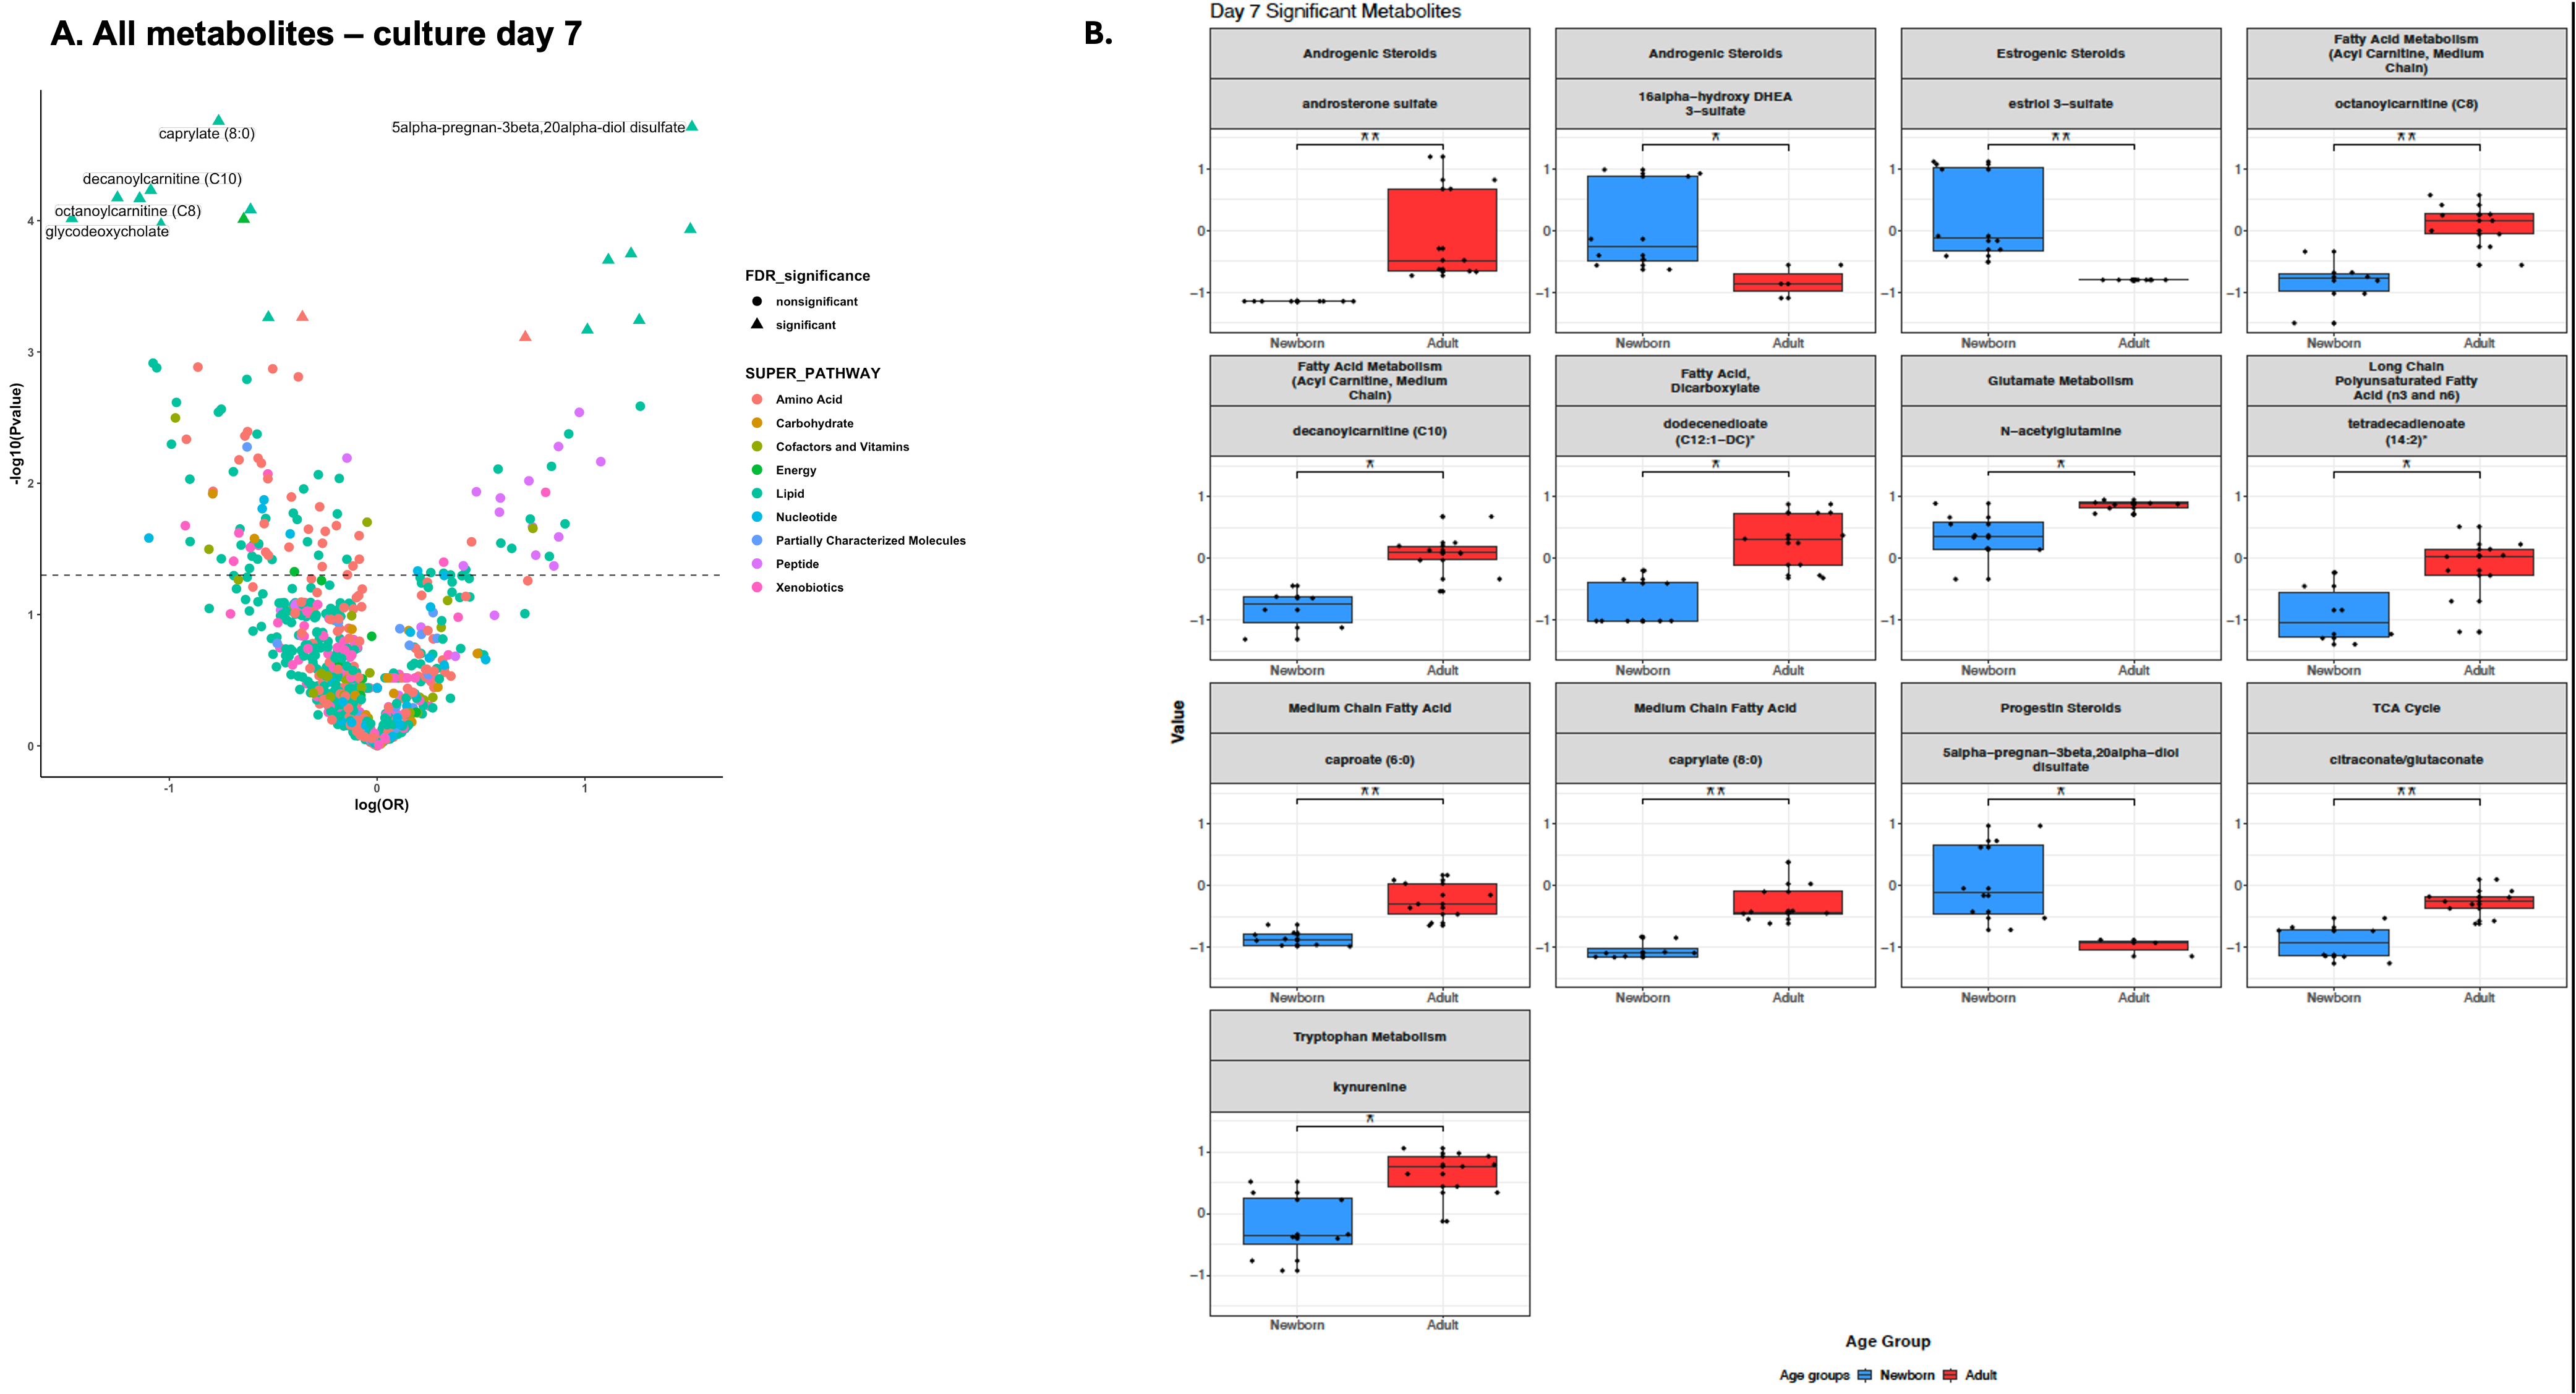 A) Volcano plot showing all metabolites whose concentrations changed 7 days after BCG-training followed by lipopolysaccharide (LPS) stimulation: 7 metabolites were upregulated and 10 were downregulated. Linear regression coefficients were used to plot effect size [log(OR), log (odds ratio)]. The top 5 False Discovery Rate (FDR) significant metabolites are labeled. B) Boxplots showing statistically significant differences in metabolite relative intensities between BCG-trained newborn vs adult Mo. There were 4 unnamed metabolites whose boxplots are not shown. Means are compared using the Wilcoxon rank sum test and p-values are adjusted for FDR using Benjamini-Hochberg (BH) procedure. * p<0.05, ** p<0.01.
 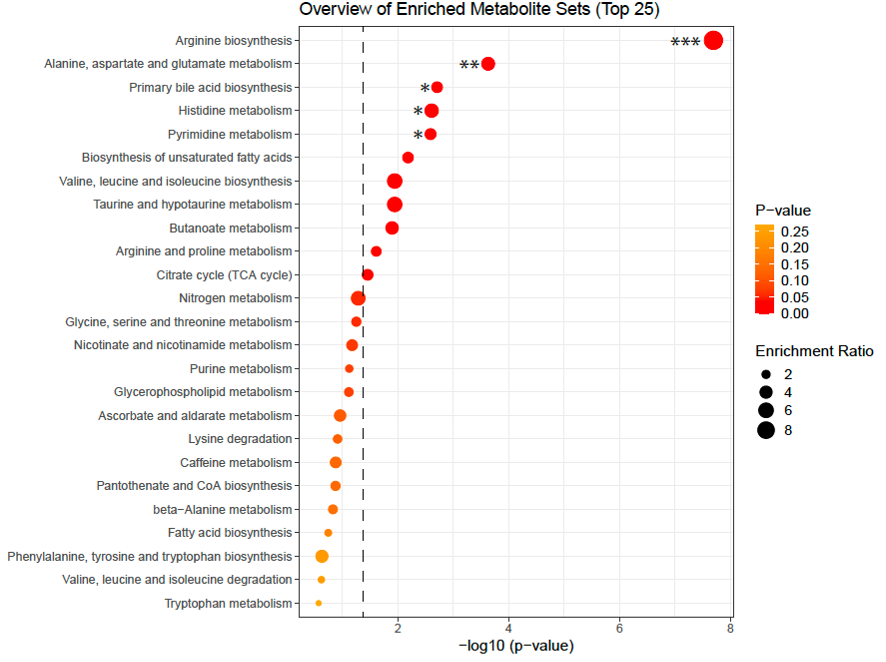 Enrichment dotplot in newborn Mo shows significant enrichment of amino acid biosynthesis/metabolism and lipid metabolic pathways. Pathway enrichment was conducted on Metaboanalyst, using the KEGG pathway. Vertical line denotes statistical significance. Stars denote p-values adjusted for False Discovery Rate (FDR) using Benjamini-Hochberg (BH) procedure.
 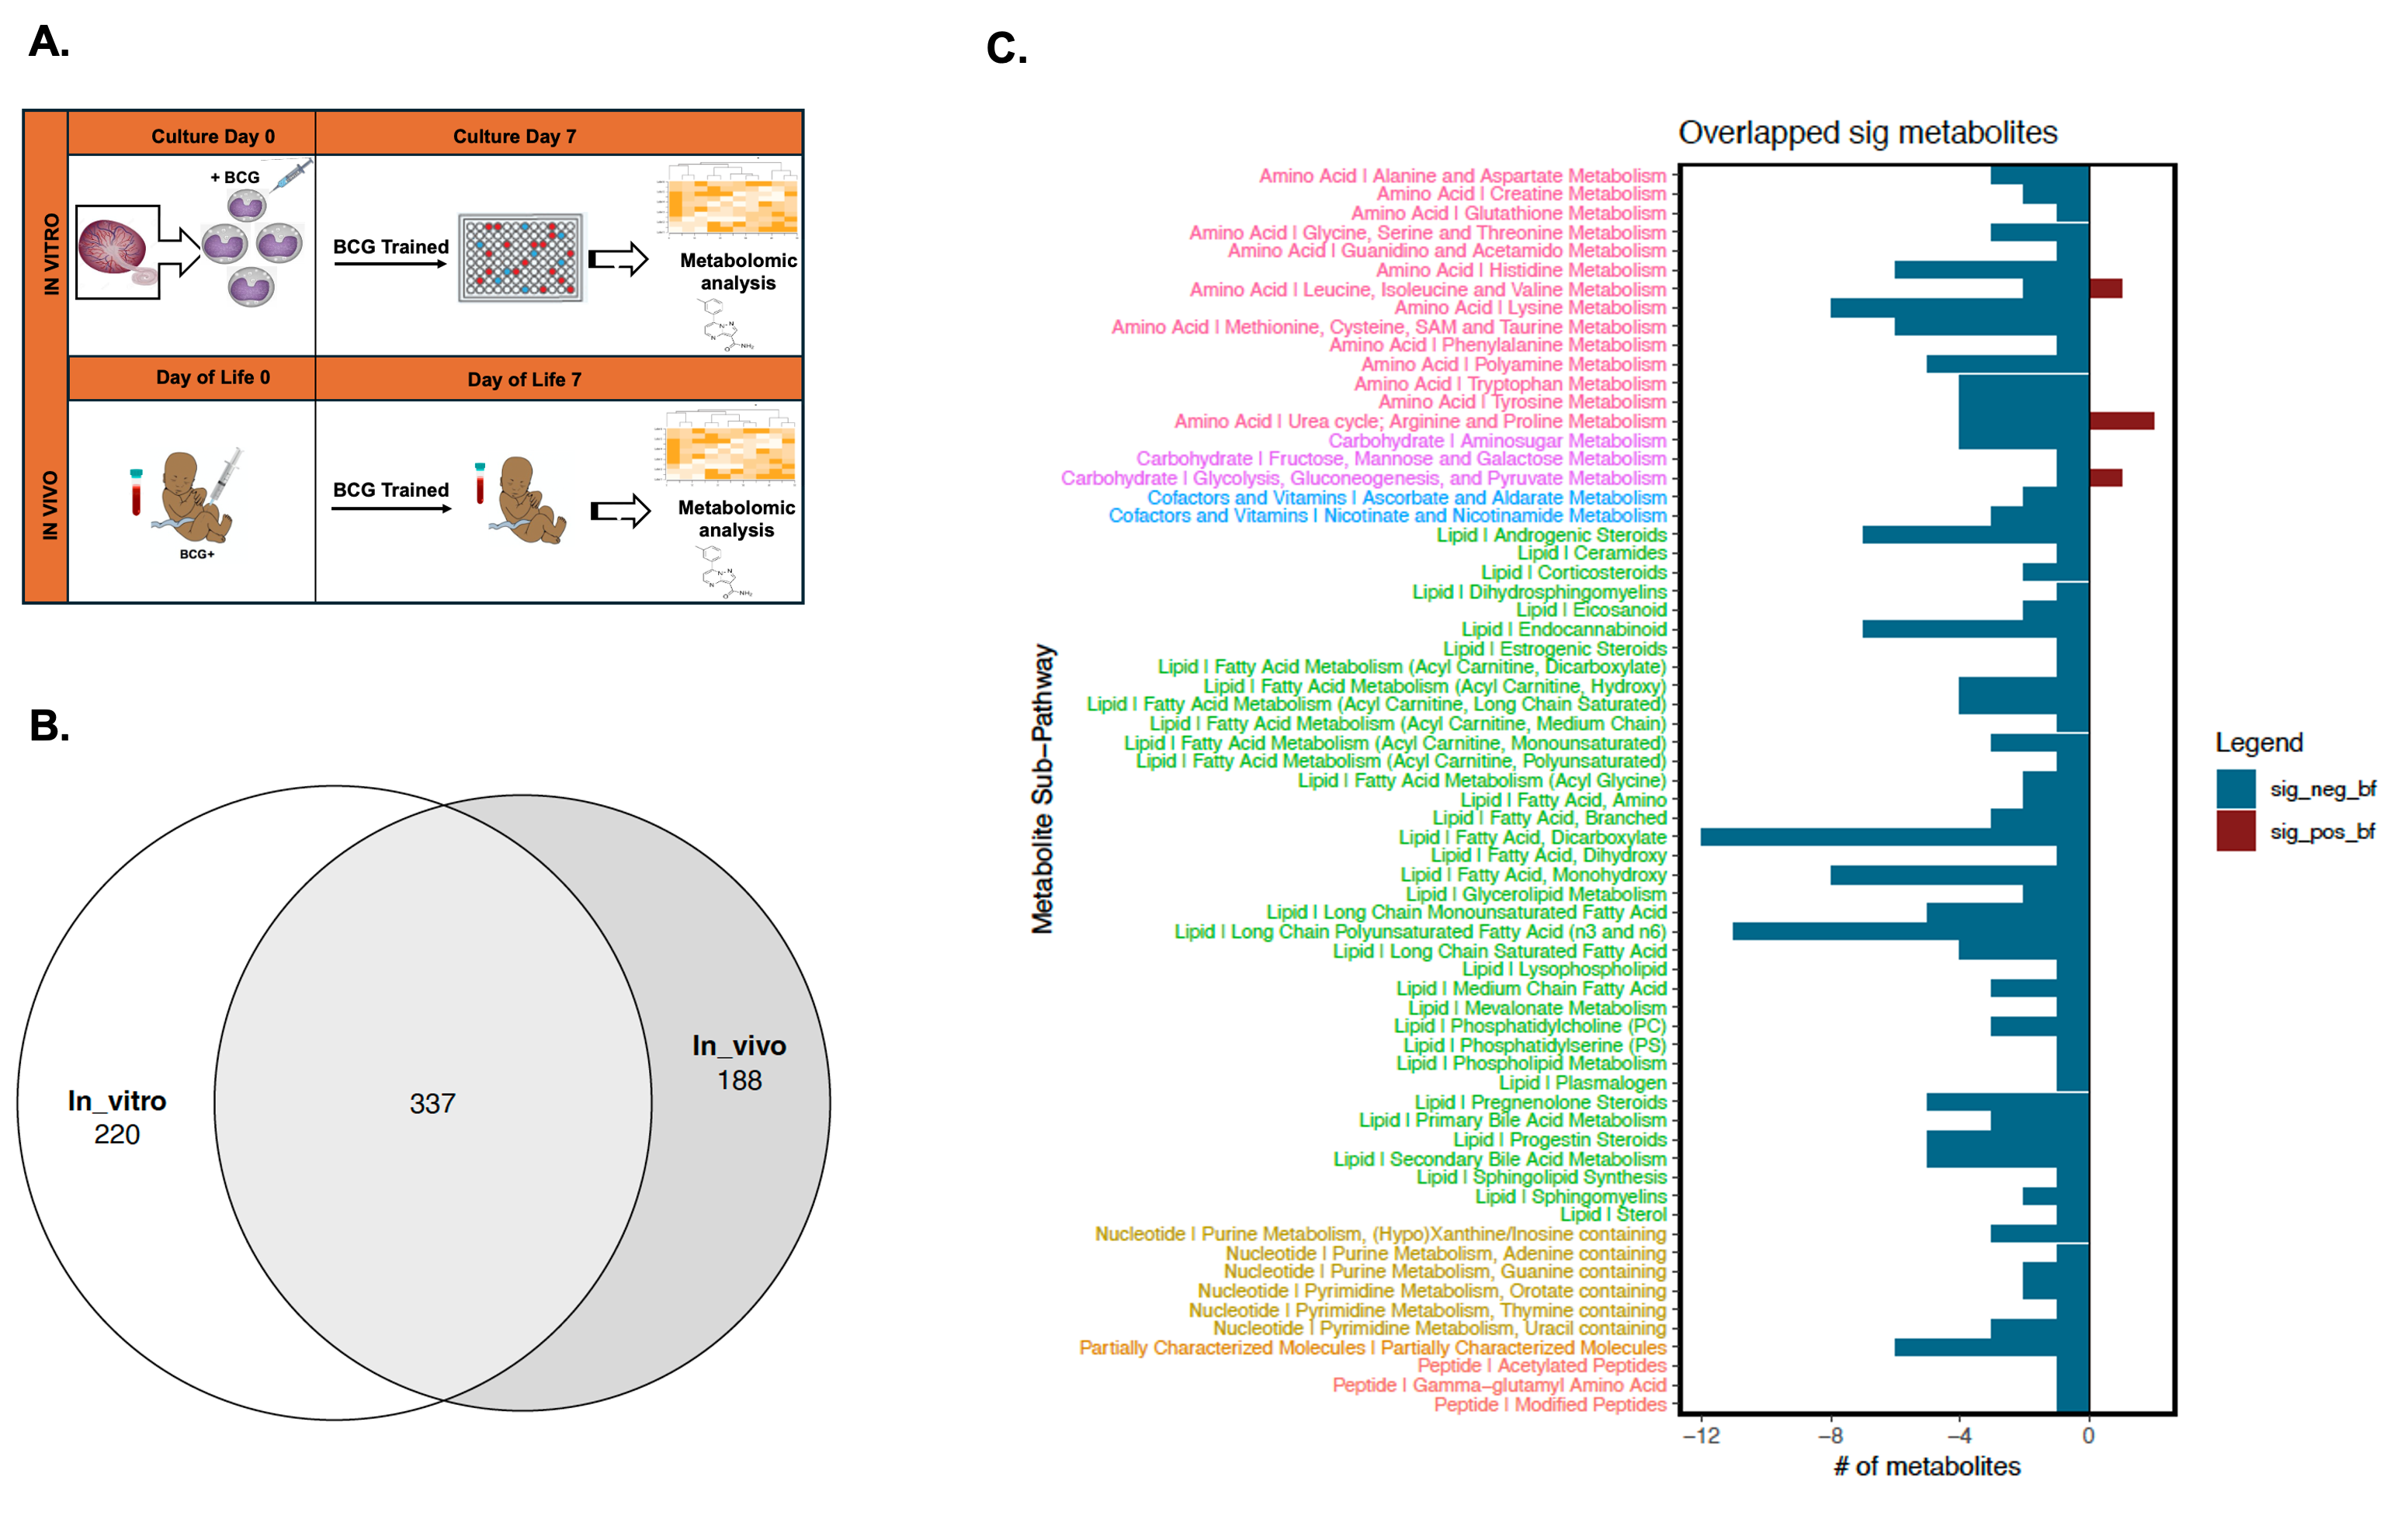 A) Schema of study design for validation of in vitro metabolomics in an in vivo newborn cohort from The Gambia. B) Venn diagram showing significant metabolites detected in BCG-trained Mos in vitro (Culture Day 7), in BCG vaccinated newborns (DOL 7) and overlapping. C) Pathway bar plot of overlapping significant (p <.01 by Bonferroni correction) metabolites with the same directionality in vitro and in vivo.