305 - Lipids at Diagnosis and 1-2 Years Post-Diagnosis in Youth Onset Type 2 Diabetes
Sunday, April 27, 2025
8:30am – 10:45am HST
Publication Number: 305.5926
Nina Mondero, Ann & Robert H. Lurie Children's Hospital of Chicago, Chicago, IL, United States; Irwin Benuck, Northwestern University The Feinberg School of Medicine, Chicago, IL, United States; Wenya Chen, Ann & Robert H. Lurie Children's Hospital of Chicago, Naperville, IL, United States; Sean DeLacey, Ann & Robert H. Lurie Children's Hospital of Chicago, Chicago, IL, United States; Siyuan Feng, Northwestern University The Feinberg School of Medicine, Evanston, IL, United States; Jisel Gomez, Northwestern University The Feinberg School of Medicine, Chicago, IL, United States; Juan J. Lado, Ann & Robert H. Lurie Children's Hospital of Chicago, Chicago, IL, United States; Laura Levin, Ann & Robert H. Lurie Children's Hospital of Chicago, chicago, IL, United States; Luis Lopez, Northwestern University The Feinberg School of Medicine, Chicago, IL, United States; Adesh Ranganna, UPMC Childrens Hospital of Pittsburgh, Pittsburgh, PA, United States; Monica E. Bianco, Northwestern University, Chicago, IL, United States
Research Volunteer Ann & Robert H. Lurie Children's Hospital of Chicago Chicago, Illinois, United States
Background: Type 2 Diabetes Mellitus (T2DM) is a rapidly increasing disease in adolescents characterized by beta-cell dysfunction and insulin resistance. Studies have shown that pre-diabetic states are linked to high levels of triglyceride (TG) and low levels of high-density lipoprotein cholesterol (HDL-C). However, the prevalence of these at diagnosis of youth onset T2DM and the changes after treatment is not well described. We aim to describe the changes in cholesterol levels in youth onset T2DM at diagnosis and 1-2 years post-diagnosis. Objective: The primary objective is to examine and characterize associations between individual cholesterol values (Total cholesterol (TC), LDL, HDL, TG, TG/HDL-C and TC/HDL-C ratios) in patients with a diagnosis of Type 2 Diabetes. Objectives include: 1) Quantifying the levels of cholesterol values at diagnosis of T2DM and 2) Understanding how treatment may modulate the change in cholesterol values at 1-2 years post-diagnosis. Design/Methods: This is a retrospective review of electronic medical records for children 0-18 years of age who were newly diagnosed with type 2 diabetes (defined as HgbA1c >6.5%, OR OGTT results (Fasting >126 OR 2hr >than 200), OR a random blood glucose of >200) at Lurie Children’s hospital or any of Lurie Children’s satellite locations between 1/1/2010 and 6/30/2023. Outcome measures were abstracted from the medical record and included: age, height, weight, BMI, HgbA1C, basic metabolic panel, complete metabolic panel, initial treatment regimen, race, ethnicity, and lipid profile. Results: Analysis included 457 patients with T2DM. HgbA1c mean decreased from 8.96% to 7.24% 1-2 years post-diagnosis (p= < 0.001). Average TC (p= 0.02), TG (p=0.02), TG/HDL-C (p= 0.01), and TC/HDL-C (p=0.004) decreased significantly from diagnosis to post-diagnosis. Finally, HDL-C (p= < 0.001) improved significantly from diagnosis to post-diagnosis. LDL-C was the only cholesterol value that was not noted to change significantly after diagnosis.
Conclusion(s): High levels of TC, TG, TG/HDL-C, and TC/HDL-C, and low levels of HDL-C are common at diagnosis of youth onset T2DM, but often improve by 1 year follow up. Future goals include comparing the degree of lipid changes 1-2 years prior to diagnosis to diagnosis values and to test the hypothesis that elevated TG/HDL-C ratio or TC/HDL-C at diagnosis of T2DM will be associated with worse glycemic outcomes at 1-2 years post-diagnosis.
Table 1. Patient demographics and clinical characteristics at type 2 diabetes diagnosis Note. Data were reported as n (%) for categorical variables and mean (SD) for continuous variables.
Table 2. Lipid panel and HgbA1C levels at diagnosis and follow-up 
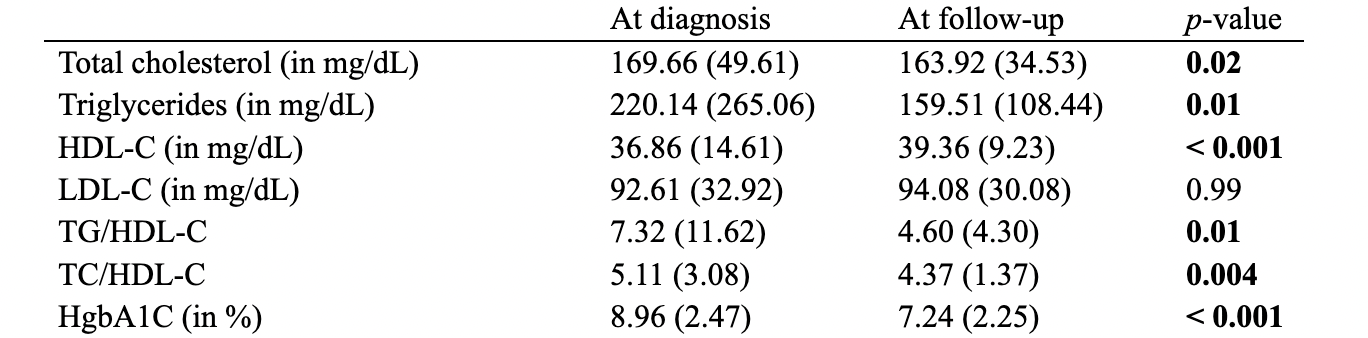
Note. Data were reported as mean (SD). Paired-sample t tests were performed to examine whether patients’ lipid panel and HgbA1C levels were different between the time of diagnosis and follow-up. Bonferroni correction was used to adjust p-values. The results suggest that there were significant changes in total cholesterol, triglycerides, HDL-C, TG/HDL-C, TC/HDL-C, and HgbA1C levels from diagnosis to follow-up, with LDL-C levels remaining stable.