
Neonatal Neurology 6: Neurodevelopment
Session: Neonatal Neurology 6: Neurodevelopment
 photo")
Alaina Martens, PhD, CCC-SLP (she/her/hers)
Postdoctoral Research Associate
Northeastern University
Quincy, Massachusetts, United States
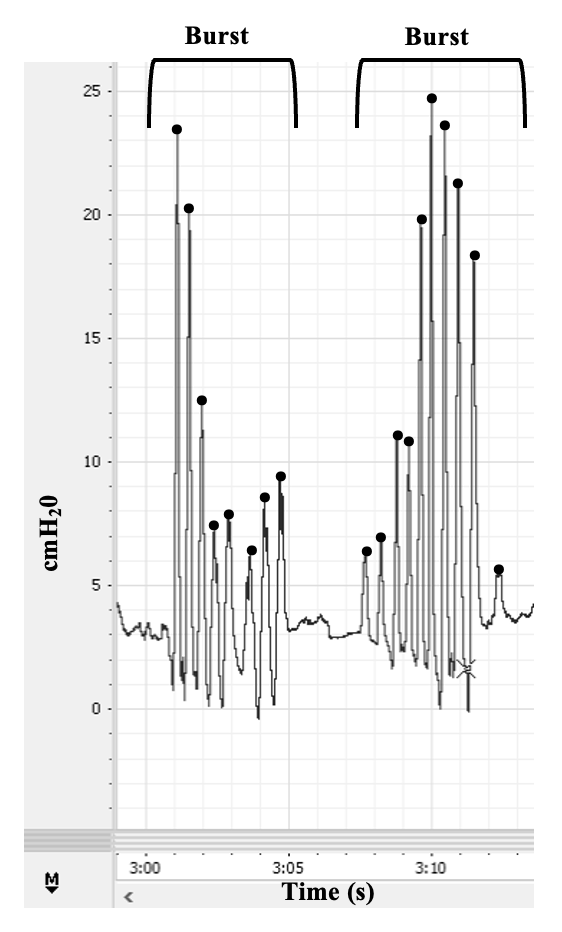 An example of an infant’s NNS waveform in LabChart. The x-axis is time (s) and the y-axis is amplitude (cmH20). This infant has two NNS bursts with 8 cycles (black dots) in burst 1 and 10 cycles in burst 2.
 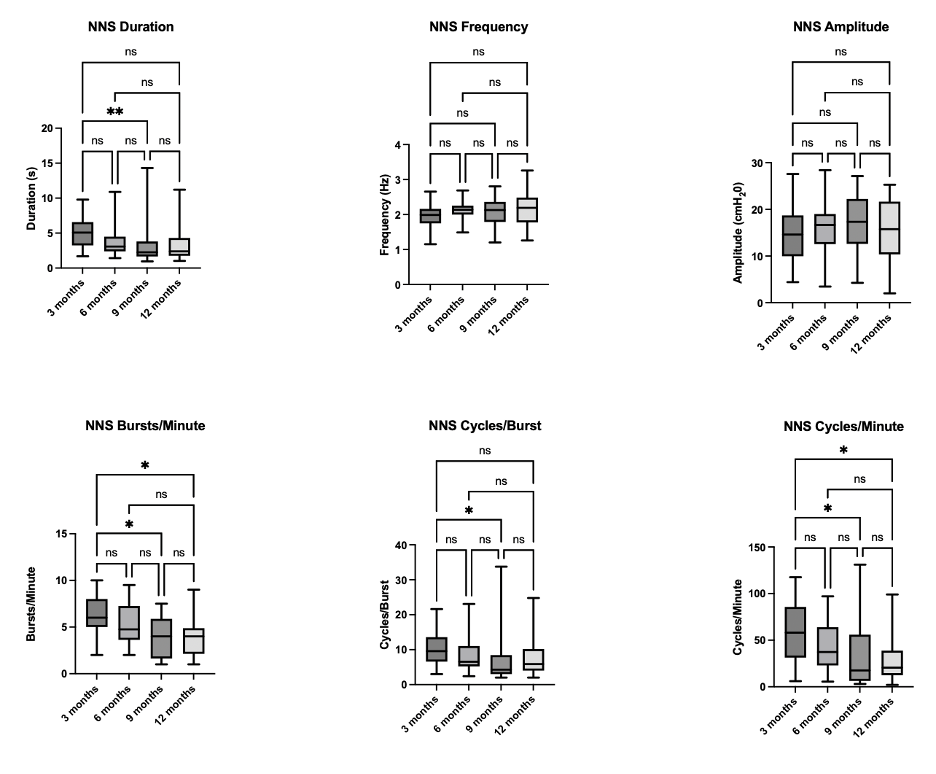 Boxplots of NNS distributions comparing 3, 6, 9, 12 month timepoints. *Indicates a significant difference in means.