
Neonatal Neurology 6: Neurodevelopment
Session: Neonatal Neurology 6: Neurodevelopment

Katy Tarrit, PhD
Assistant Professor
University of Hawaii
Honolulu, Hawaii, United States
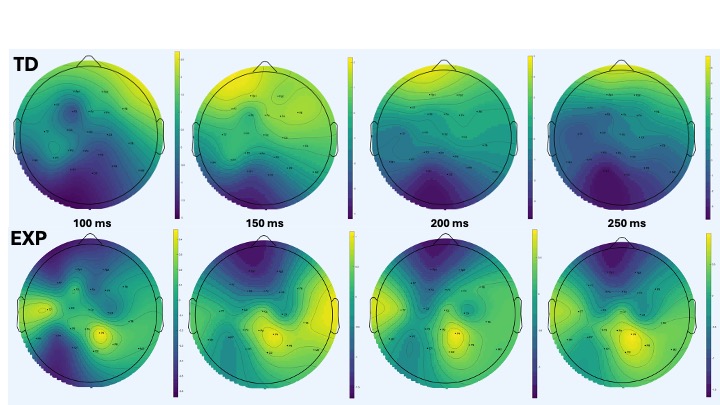 This figure represents the topographic map of Mismatch Negativity waveform difference between standard and frequency tones for both groups (Typically Developing (TD) and Exposed (EXP) newborns) between 100 and 250 ms, every 50 ms.
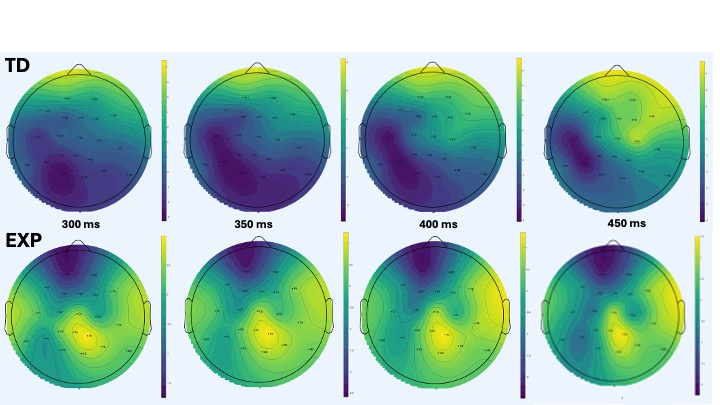 This figure represents the topographic map of Mismatch Negativity waveform difference between standard and frequency tones for both groups (Typically Developing (TD) and Exposed (EXP) newborns) between 300 and 450 ms, every 50 ms.