
Nephrology 1
Session: Nephrology 1
 photo")
Yitong A. Liu, MD (he/him/his)
Assistant Professor
University of New Mexico School of Medicine
Albuquerque, New Mexico, United States
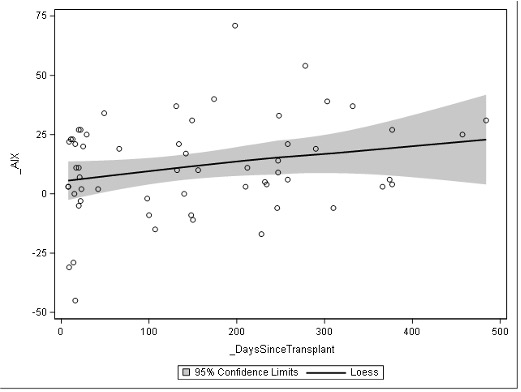 Loess plot of individual actuation index levels over time in days
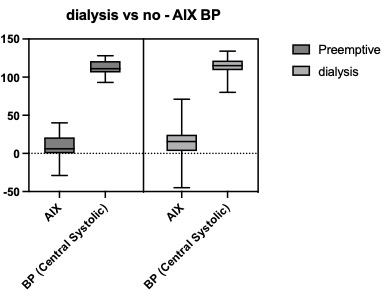 No significant difference was noted in actuation index or central systolic blood pressure ranges in kidney transplant patients who did and did not receive dialysis (either HD or PD) prior to kidney transplant
 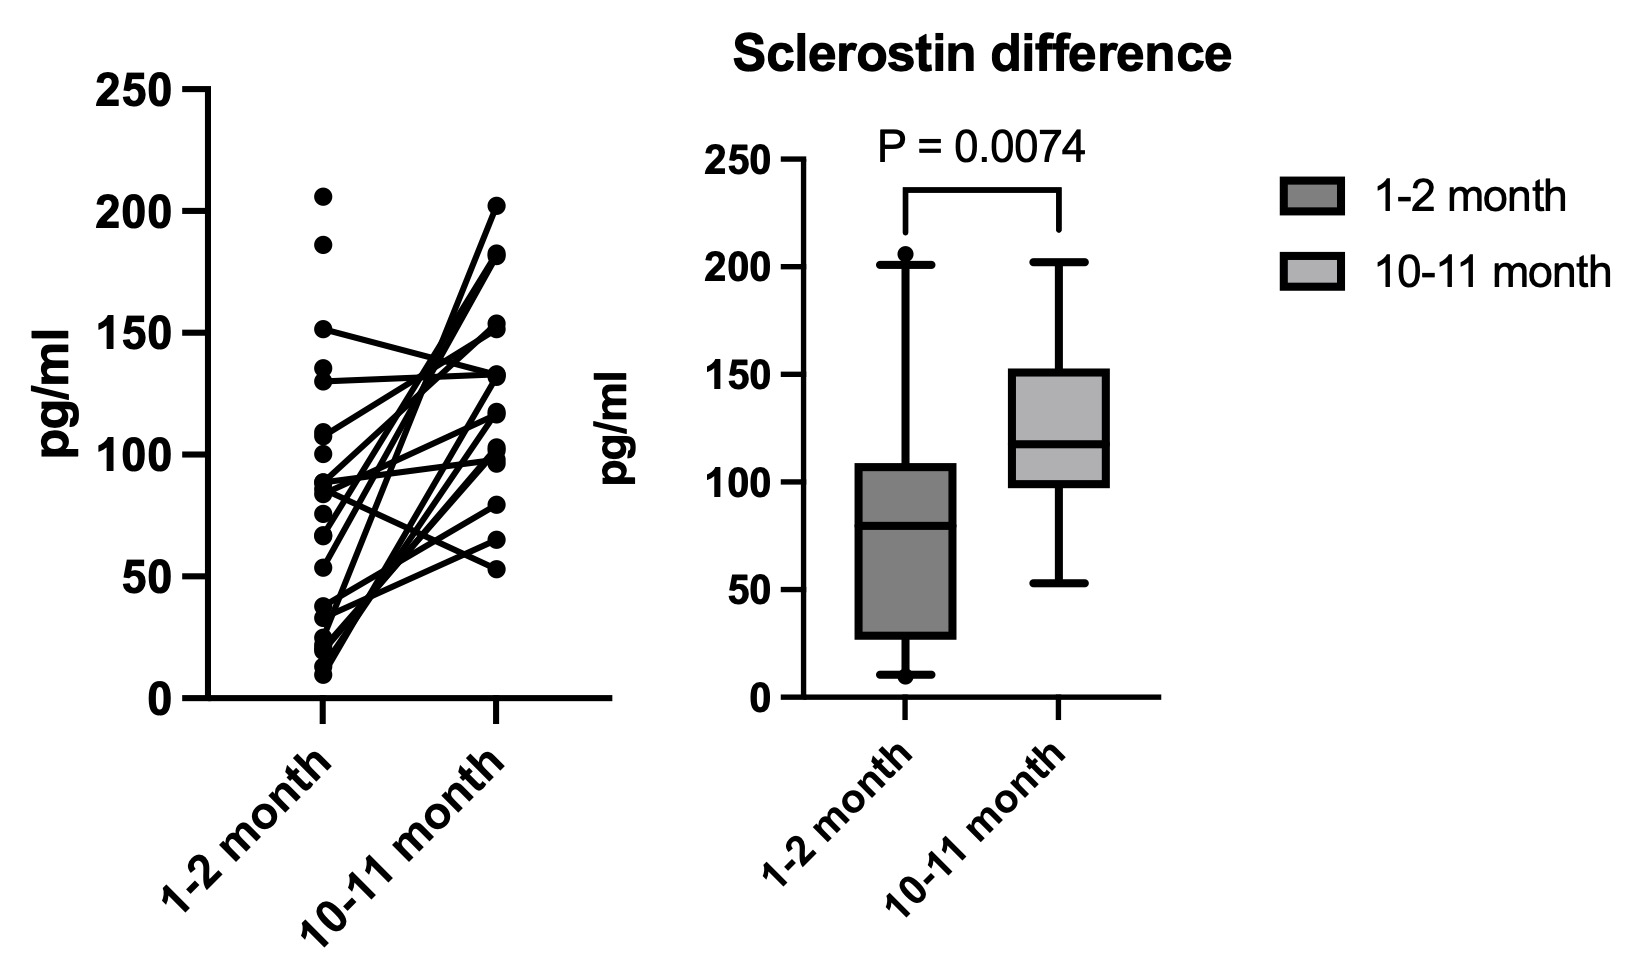 Sclerotin levels via ELISA in early (1-2 months) and late (10-11 months) in the first post-transplant year. There is a modest rise in the sclerotin level over the first transplant year (p <0.01).Loess plot of individual actuation index levels over time in daysNo significant difference was noted in actuation index or central systolic blood pressure ranges in kidney transplant patients who did and did not receive dialysis (either HD or PD) prior to kidney transplant Sclerotin levels via ELISA in early (1-2 months) and late (10-11 months) in the first post-transplant year. There is a modest rise in the sclerotin level over the first transplant year (p <0.01).