
Environmental Health 1
Session: Environmental Health 1
.jpg "Marissa Hauptman, MD, MPH (she/her/hers) photo")
Marissa Hauptman, MD, MPH (she/her/hers)
Co-Director
Pediatric Environmental Health Center, Boston Children’s Hospital
Boston, Massachusetts, United States
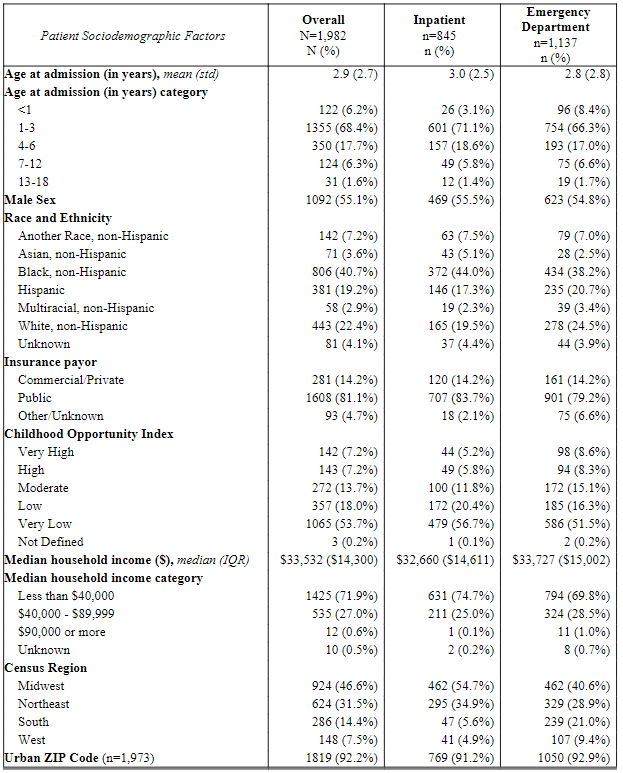 Patient sociodemographic factors among patients with encounters for lead poisoning by encounter type (N=1,982).
 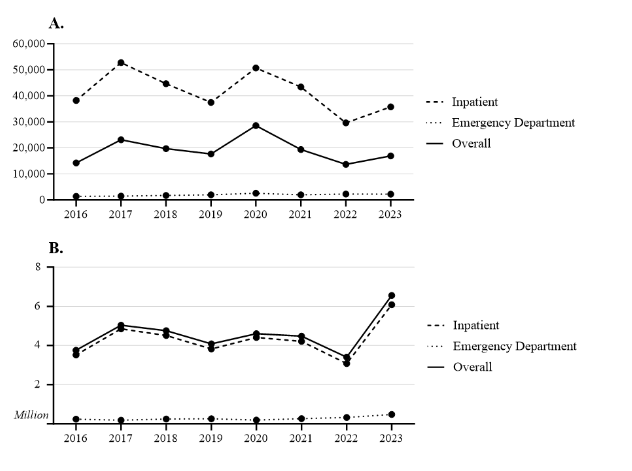 A) Mean total billed charges ($) and B) cumulative total billed charges ($, millions) for patients with lead poisoning by year and encounter type (n=1,982).
 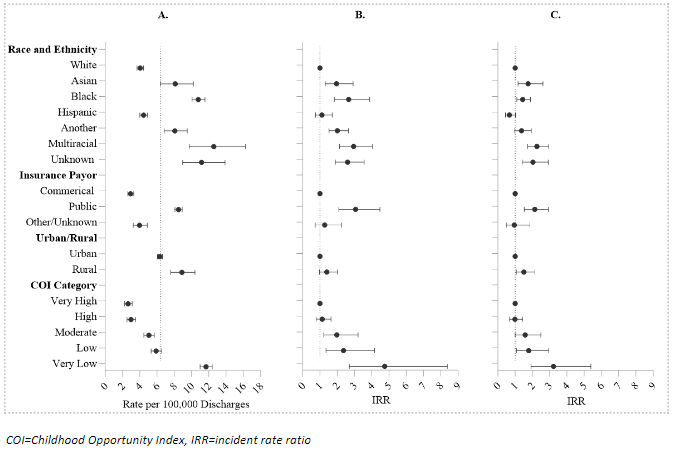 A) Crude rate of encounters for lead poisoning by patient sociodemographic factors, B) unadjusted incidence rate ratios by patient sociodemographic factors accounting for within-hospital state variation, and C) adjusted incidence rate ratios by patient sociodemographic factors accounting for within-hospital state variation, inpatient and emergency department, 2016-2023 (n=1,982).Patient sociodemographic factors among patients with encounters for lead poisoning by encounter type (N=1,982). A) Mean total billed charges ($) and B) cumulative total billed charges ($, millions) for patients with lead poisoning by year and encounter type (n=1,982). A) Crude rate of encounters for lead poisoning by patient sociodemographic factors, B) unadjusted incidence rate ratios by patient sociodemographic factors accounting for within-hospital state variation, and C) adjusted incidence rate ratios by patient sociodemographic factors accounting for within-hospital state variation, inpatient and emergency department, 2016-2023 (n=1,982).