
Nephrology 3
Session: Nephrology 3
 photo")
Nils D. Mertens, MD (he/him/his)
Resident
Boston Children's Hospital
Cambridge, Massachusetts, United States
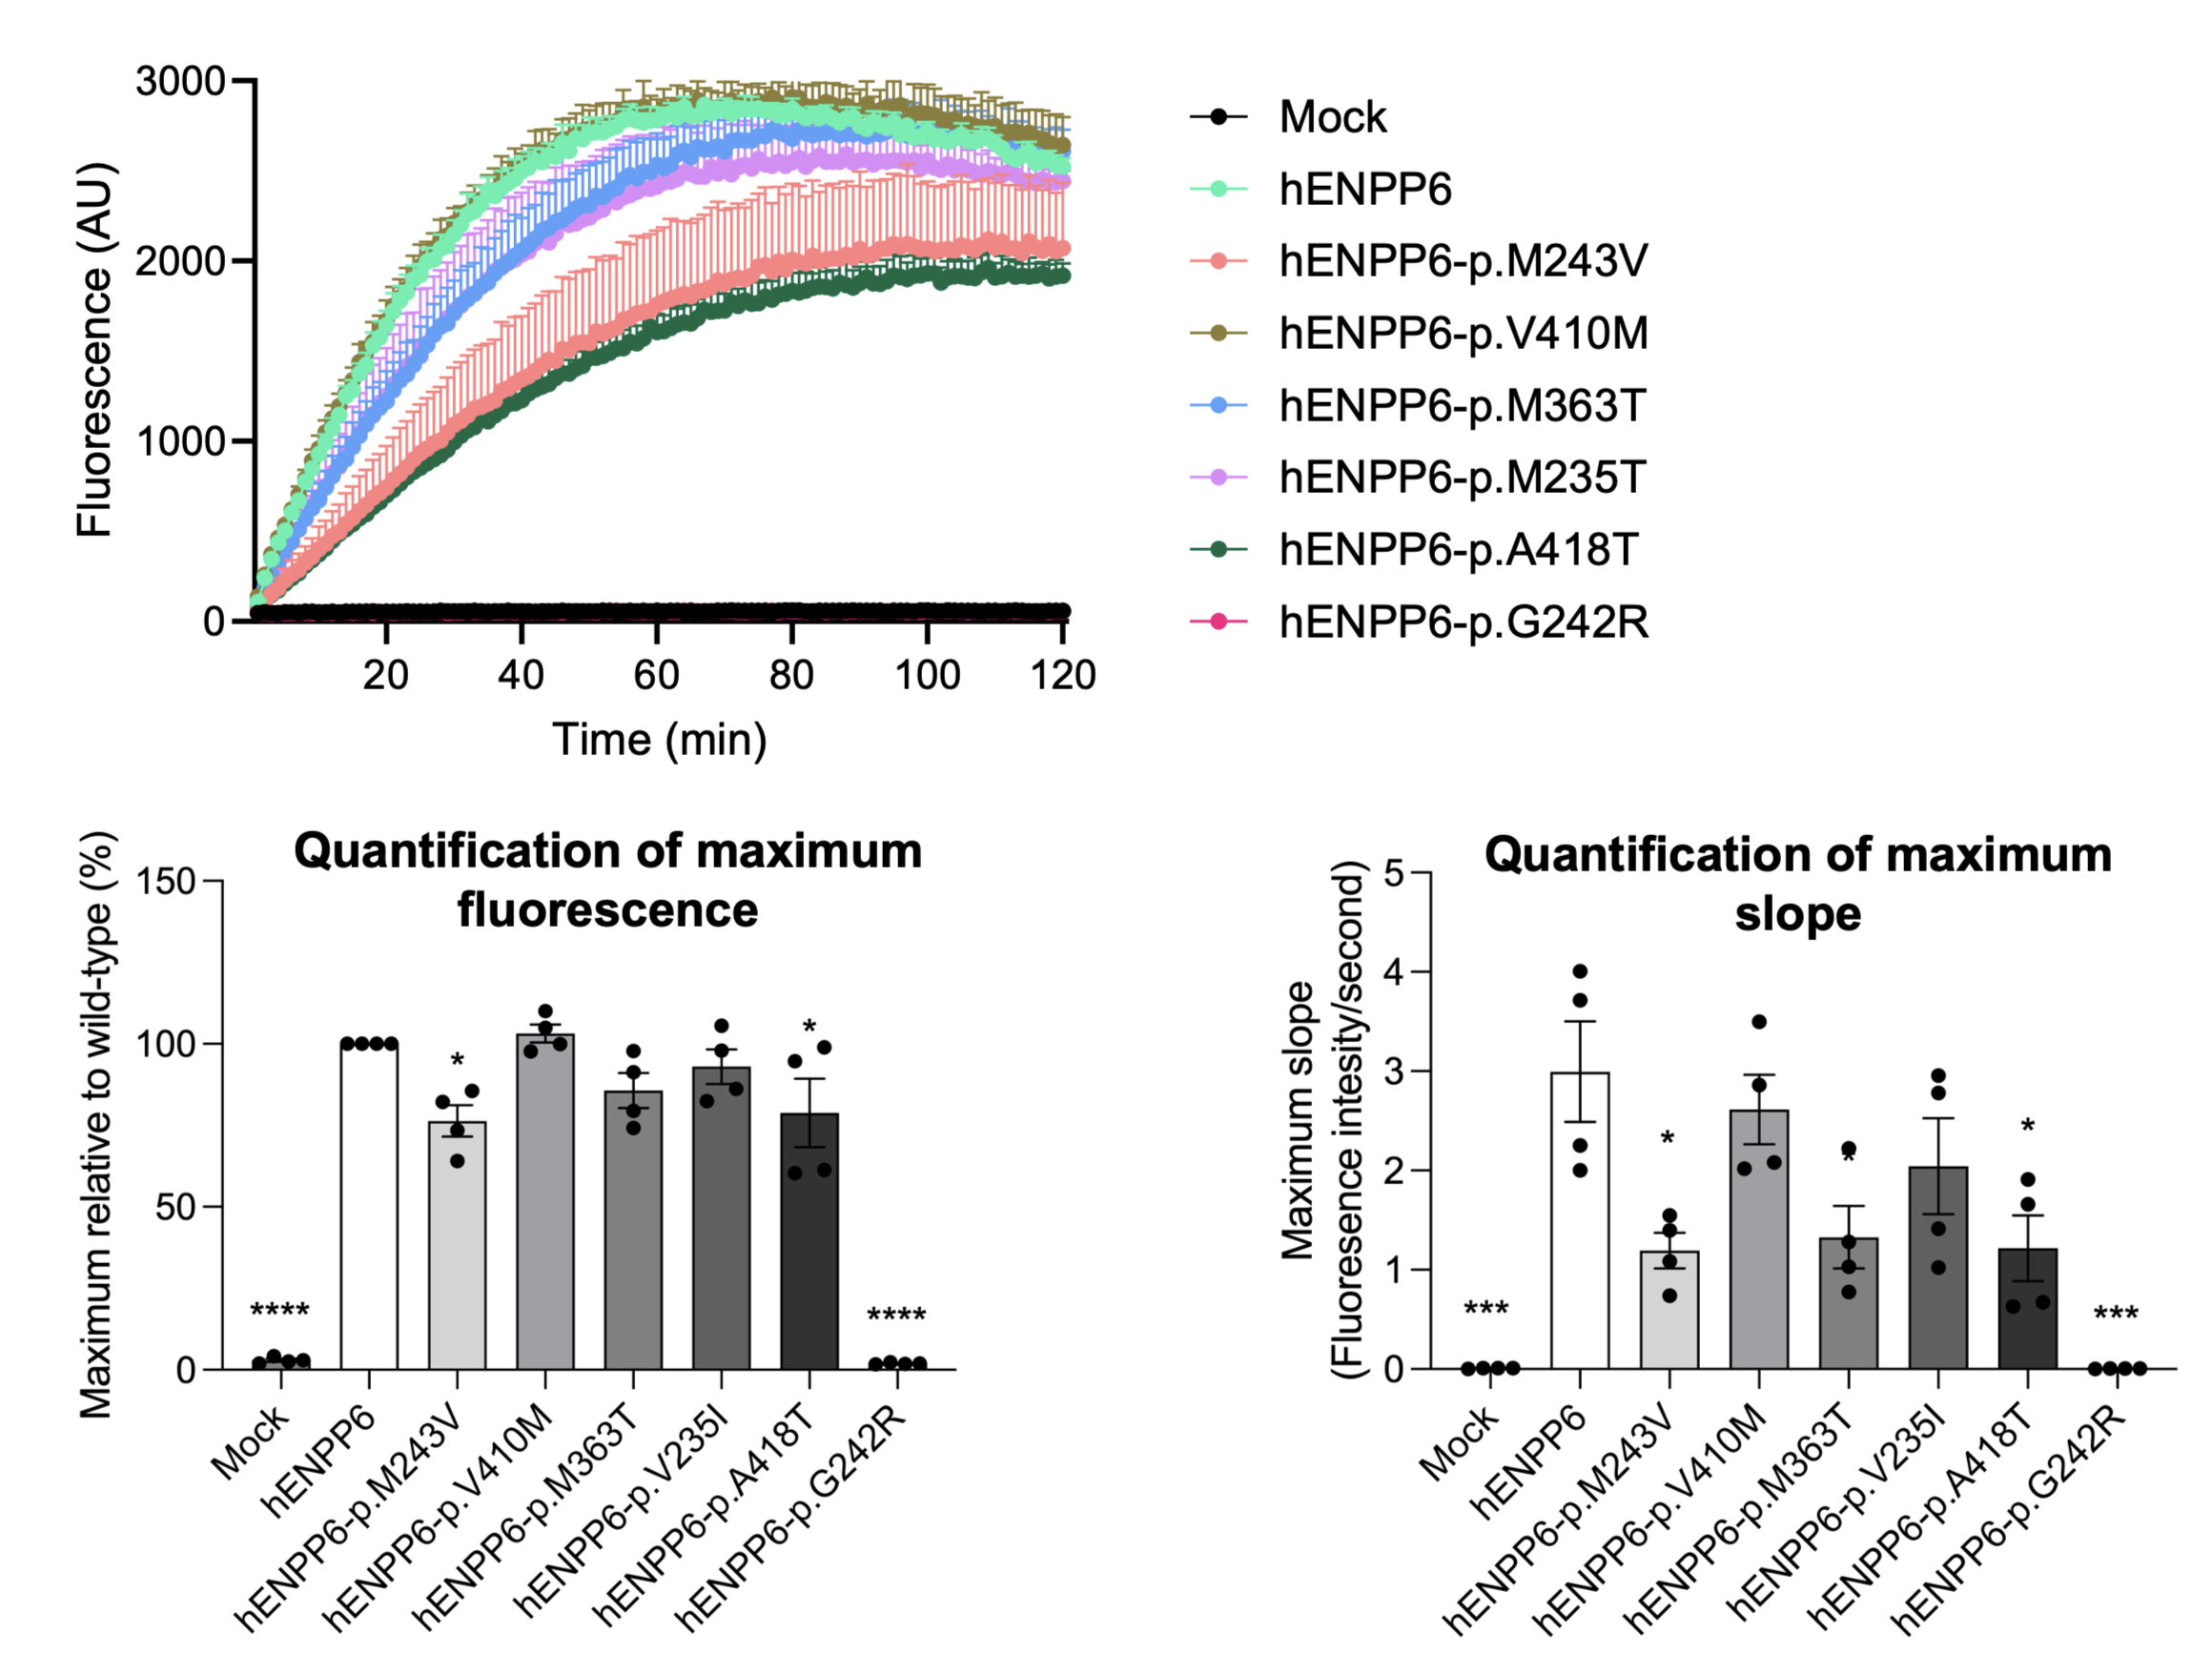 Graphs on the left depict the measured fluorescence over time after adding TG-mPC to HEK293 cells, overexpressing different human ENPP6 mutants. Bar graphs on the right show the statistical quantification of the maximum fluorescence and steepest rate of rise (One-way ANOVA) relative to the WT control.
 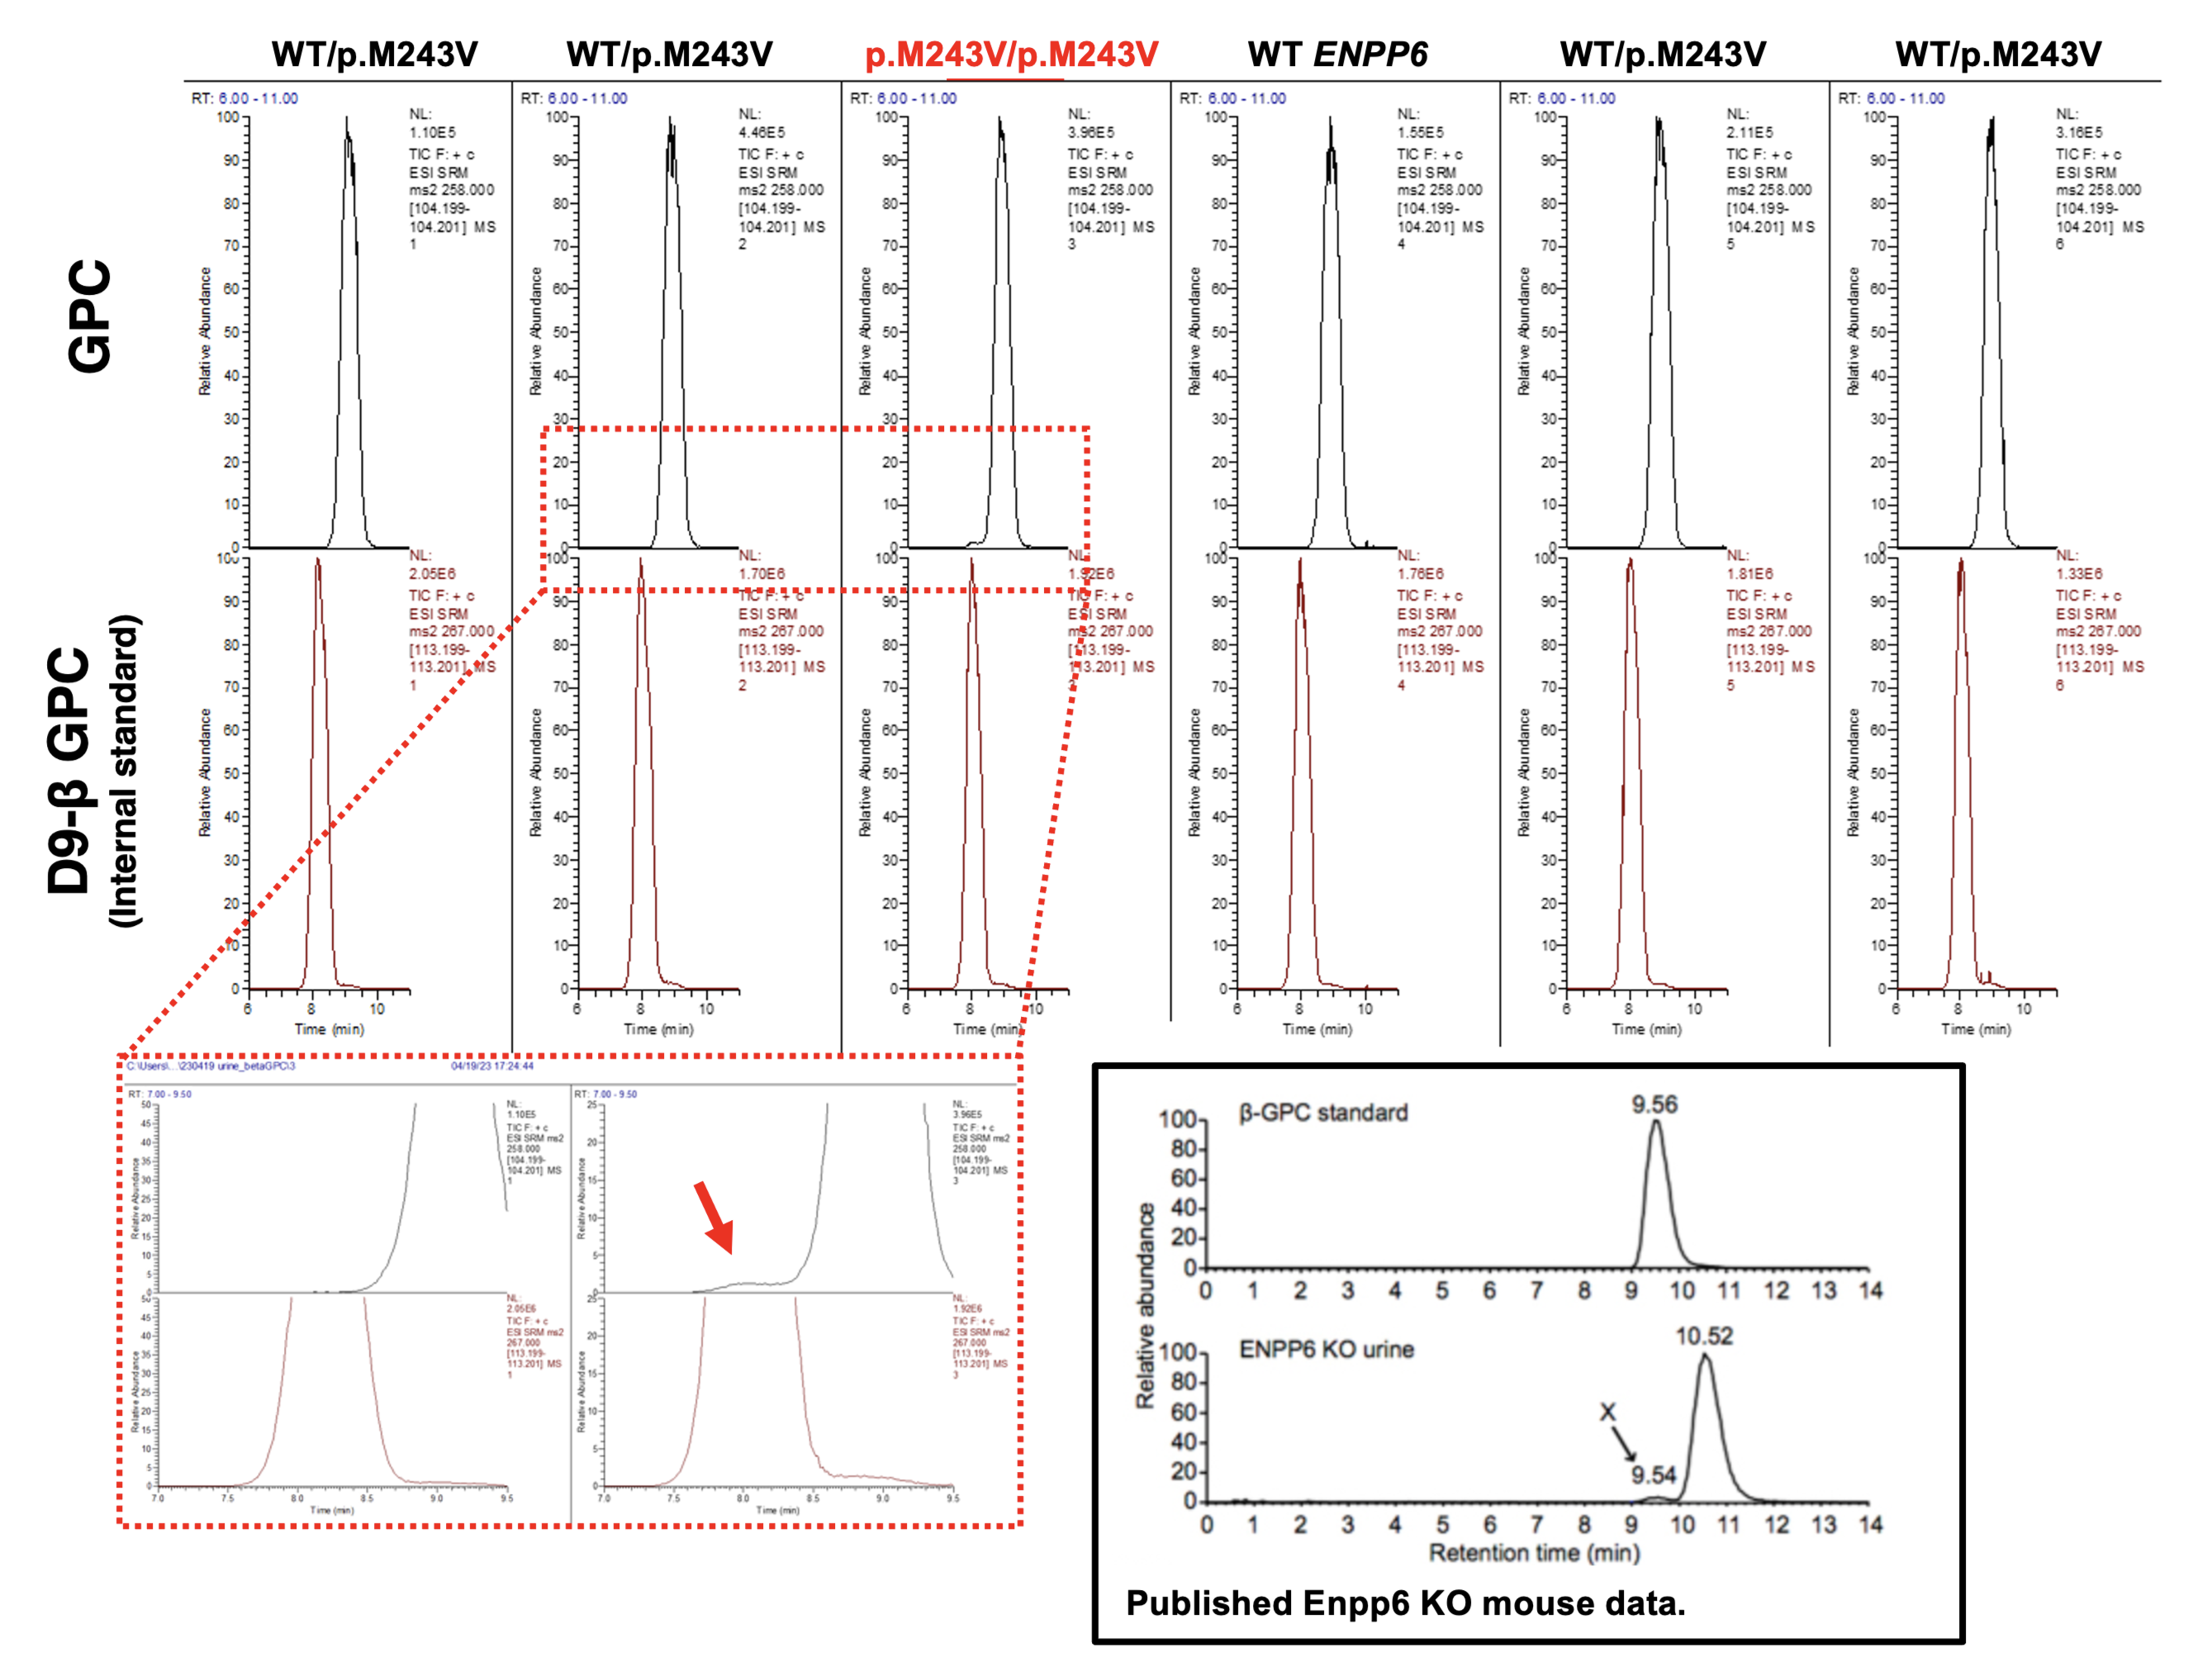 Black box on the lower right shows published data on the urinary excretion of beta-GPC found in Enpp6 KO mice (Morita et al., 2016).