
Nephrology 6
Session: Nephrology 6
 photo")
Edward Zitnik, DO (he/him/his)
Pediatric Nephrologist
University of Connecticut School of Medicine
West Hartford, Connecticut, United States
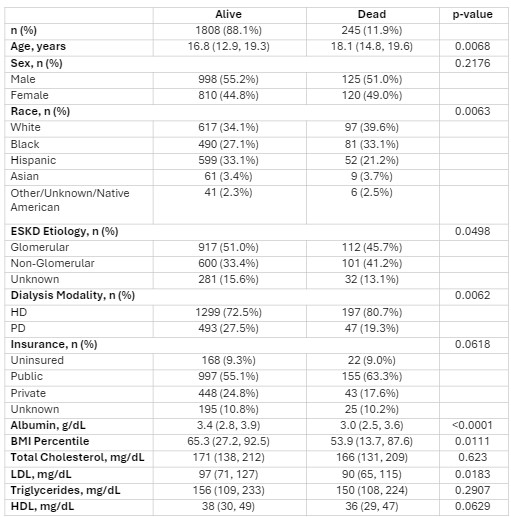 Categorial values are presented as frequency (percent) and compared using the chi-square test. Continuous variables are presented as median (interquartile range) and compared using the Wilcoxon Rank Sum test.
 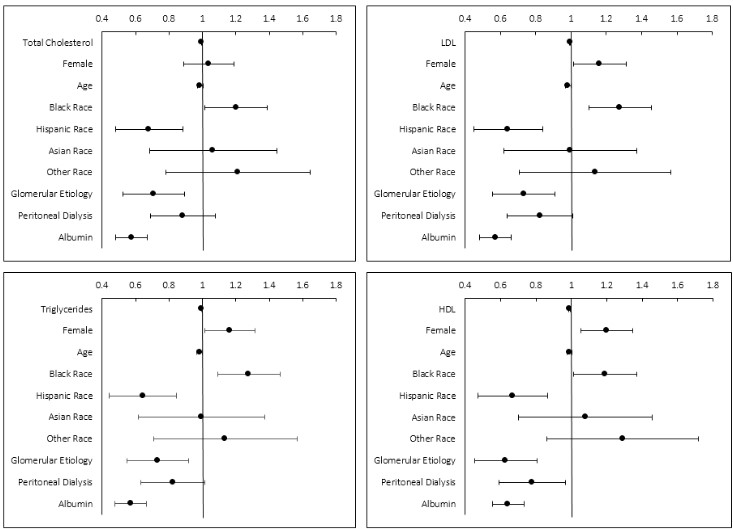 Forrest plots displaying the hazard ratio for mortality based on each lipid parameter and the variables included in each cox proportional hazard regression model.