482 - Examining Geographic Disparities Between Pediatric and Adult Asthma ED Visit Hot Spots
Sunday, April 27, 2025
8:30am – 10:45am HST
Publication Number: 482.4856
Margaret B. Nguyen, University of California, San Diego School of Medicine, San Diego, CA, United States; Daisy Valdivieso, University of California, San Diego School of Medicine, La Jolla, CA, United States; Carlos F. Gould, University of California San Diego, San Diego, CA, United States; Alexandra Heaney, University of California, San Diego, San Diego, CA, United States; Sydney leibel, Rady Children's Hospital San Diego, San Diego, CA, United States
Associate Clinical Professor University of California, San Diego School of Medicine San Diego, California, United States
Background: Compared to adults, children are disproportionately affected by asthma and air pollution. Ambient exposure to particulate matter (PM2.5), nitrogen dioxide (NO2), and ozone can exacerbate asthma. Clusters for asthma emergency department (ED) visits exist in the state of California. It is unknown if these clusters for child asthma visits exist in the same locations as those for adults. Objective: Our objective was to identify clusters of high rates, termed “hot spots”, for child asthma visits and determine if these locations are similar to hot spots for adult asthma visits. We then compare pollution levels across the hot spot categories. Design/Methods: We obtained asthma ED visit rates to 450 non-military hospitals in California from the Cal Health and Human Services Agency. Asthma ED visit rates for 2019 were reported by ZIP code and by age-adjusted category per 10,000 persons. We applied the Gi* statistic to identify hot spots (high rates) and cold spots (low rates) of ED visits among children and adults separately. We then calculated how spatially aligned the pediatric and adult clusters were by computing similarity and association values. Disparities in clustering were indicated if a ZIP was identified as a hot spot for children but not for adults. Finally, we examined differences in PM2.5, NO2, and ozone across hot spot categories. Results: We identified 35 ZIPs as coincident hot spots for both children and adults. There were 44 ZIPs categorized as hot spots for children but insignificant for adults; 17 cold spots for children and insignificant for adults; and 16 ZIPs were insignificant for children but hot spot for adults. Compared to areas with no clustering, coincident hot spots for both children and adults had PM2.5 levels that were on average 0.93 ug/m3 higher; areas identified as child hot spot but insignificant for adults demonstrated average PM2.5 increases of 1.21 ug/m3 (p < 0.05). For ZIPs that were pediatric cold spots, PM2.5 was lower by -1.17 ug/m3 (p < 0.05). There were no significant differences in NO2 or ozone.
Conclusion(s): We detected geographic locations that demonstrated distinct disparities in child asthma ED visits compared to adults. Overall, areas identified as hot spots had significantly higher levels of PM2.5 but not NO2 or ozone. This data supports growing literature that children are disproportionately affected by air pollution and asthma.
Comparison of Pediatric and Adult Asthma ED Visit Hot Spots in California, 2019 
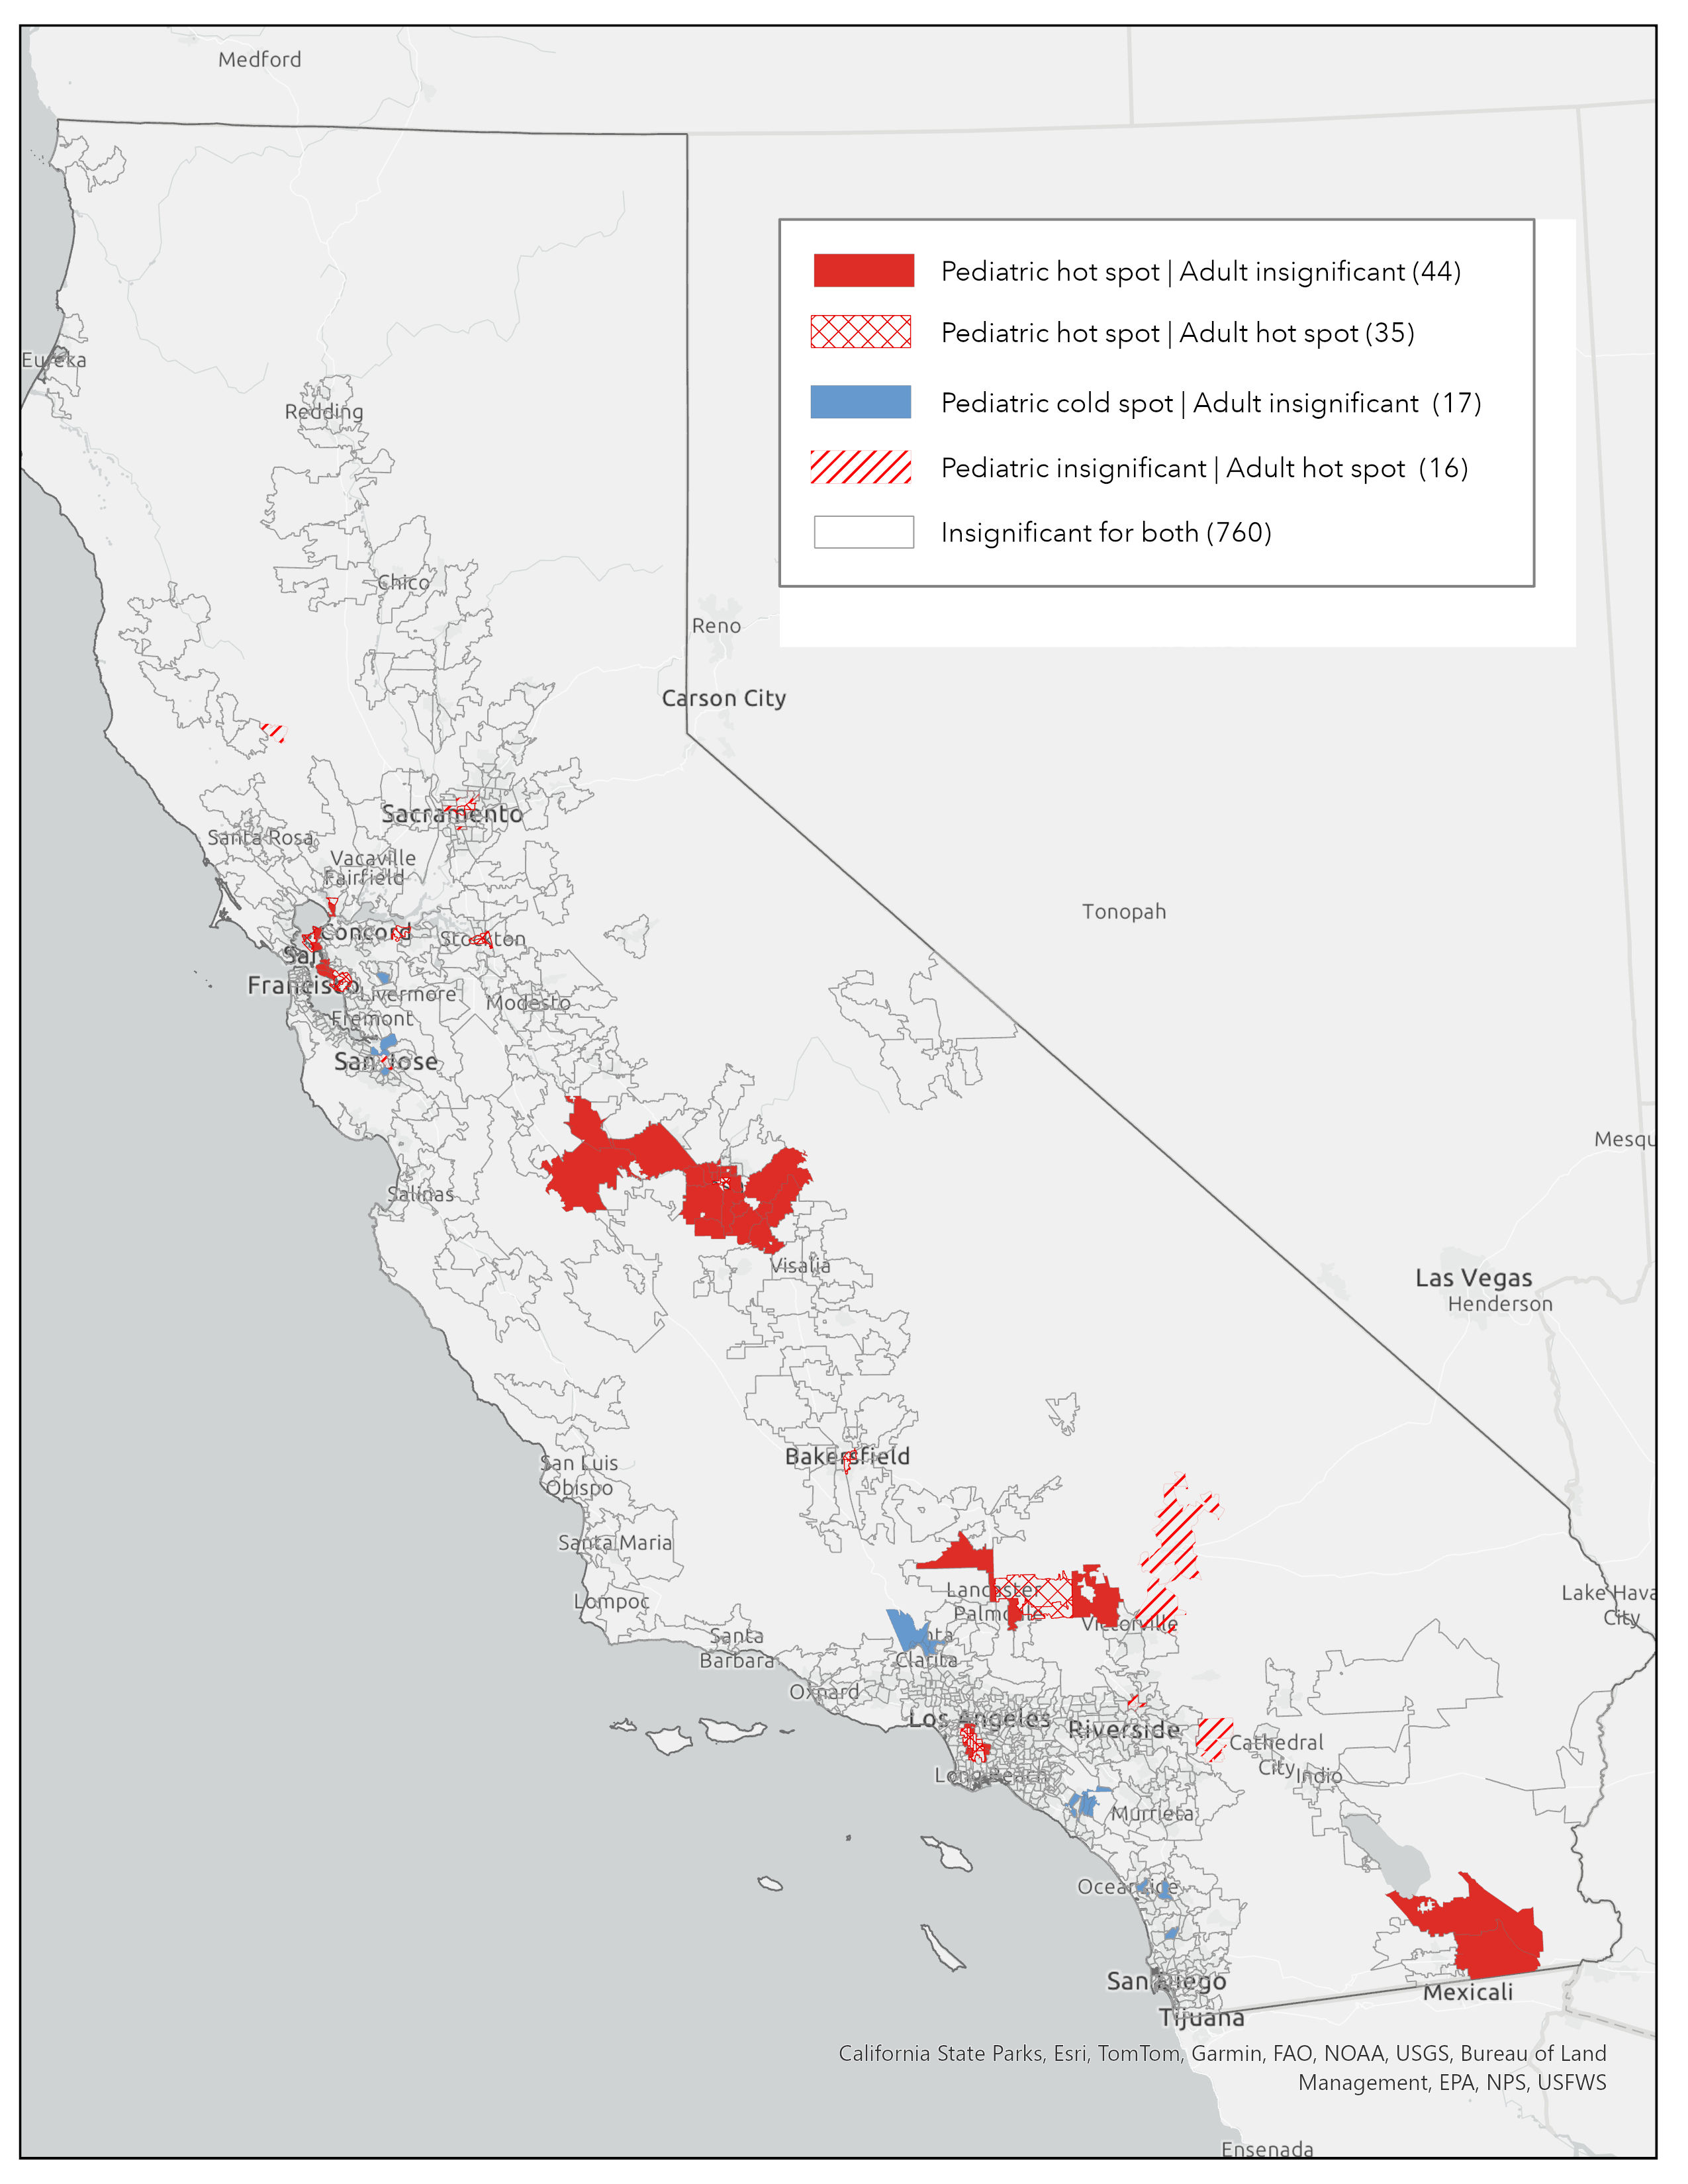
Map illustrates hot spot comparisons for pediatric and adult asthma ED visits. There were 35 ZIP codes where pediatric and adult hot spots were co-located. The 44 ZIP codes that were identified as a pediatric hot spot but not for adults raises concerns for child health disparity.
Mean particulate matter 2.5 (PM2.5) 2017-2019 by ED Visit Hot Spot Category 
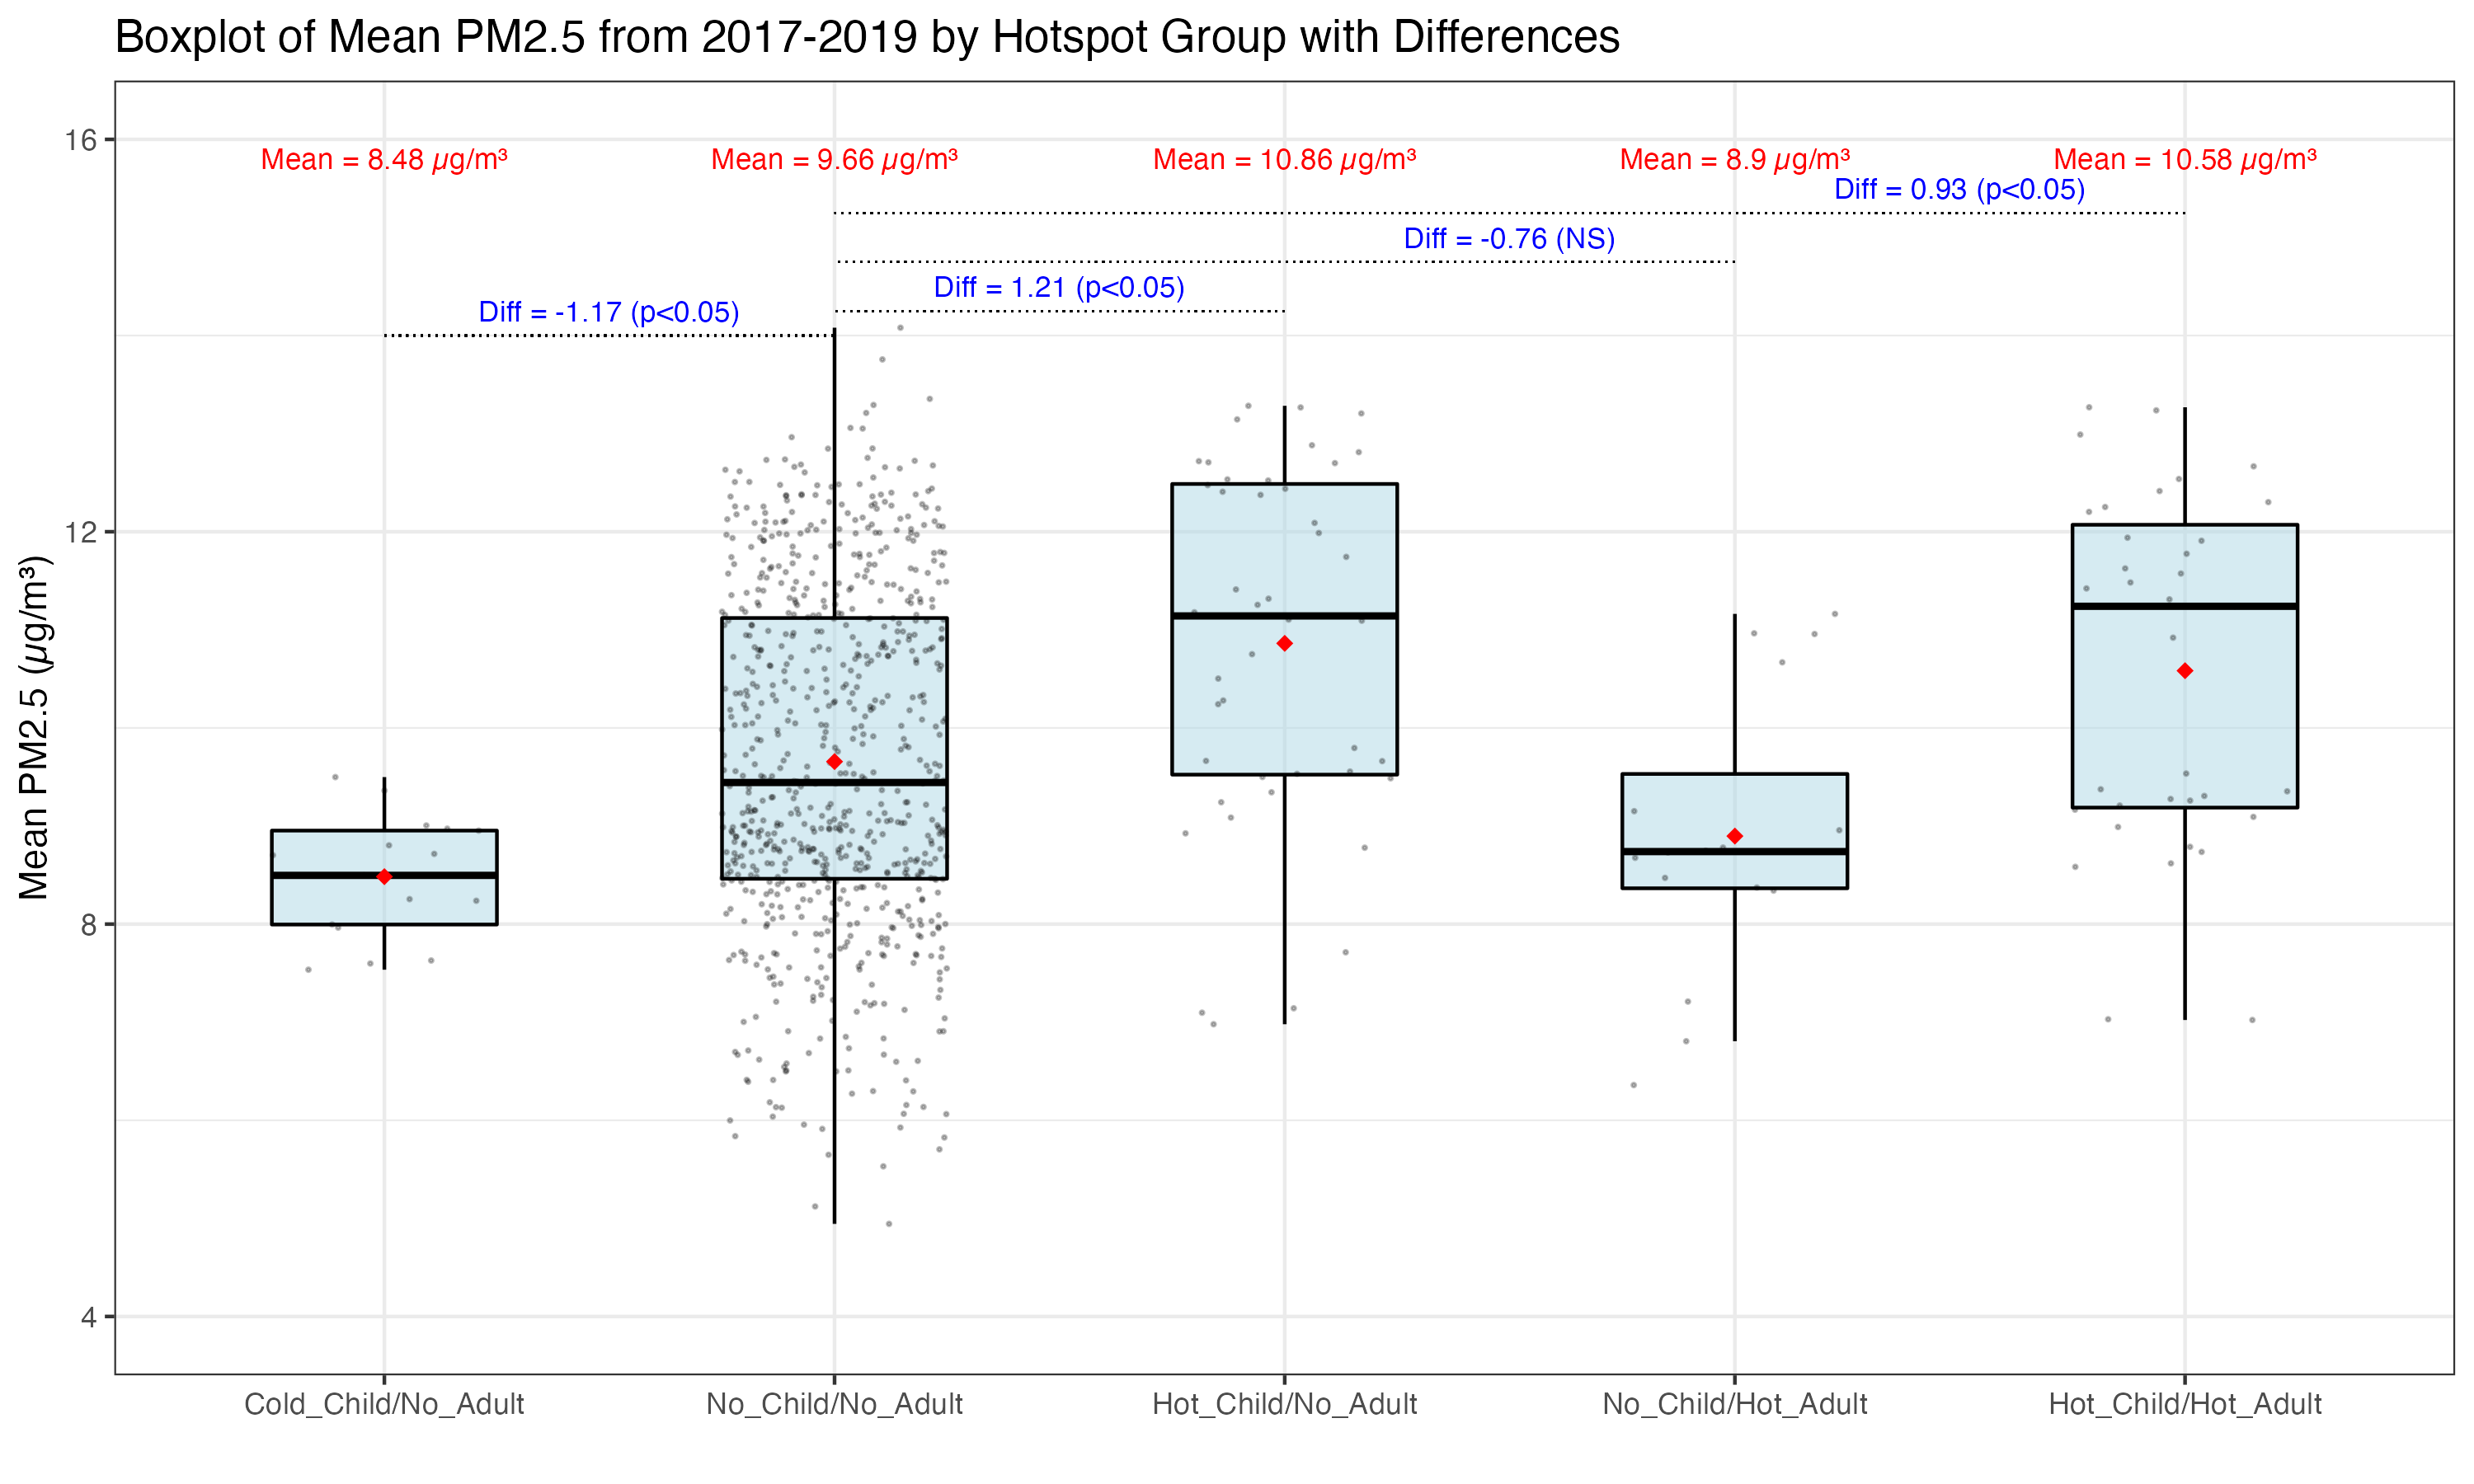
Mean PM2.5 pollution levels (y-axis) across the three years in each zip code. Boxplots represent concentrations within each category (x-axis). Red dots represent mean values. Differences in mean are shown in blue. The category of "No hot or cold spots for neither child nor adult" was set as the referent category. “NS” indicates the difference was not significant.