
Neonatal Neurology 4
Session: Neonatal Neurology 4
 photo")
Srinivas Kota, PhD (he/him/his)
Assistant Professor
University of Texas Southwestern Medical School
Dallas, Texas, United States
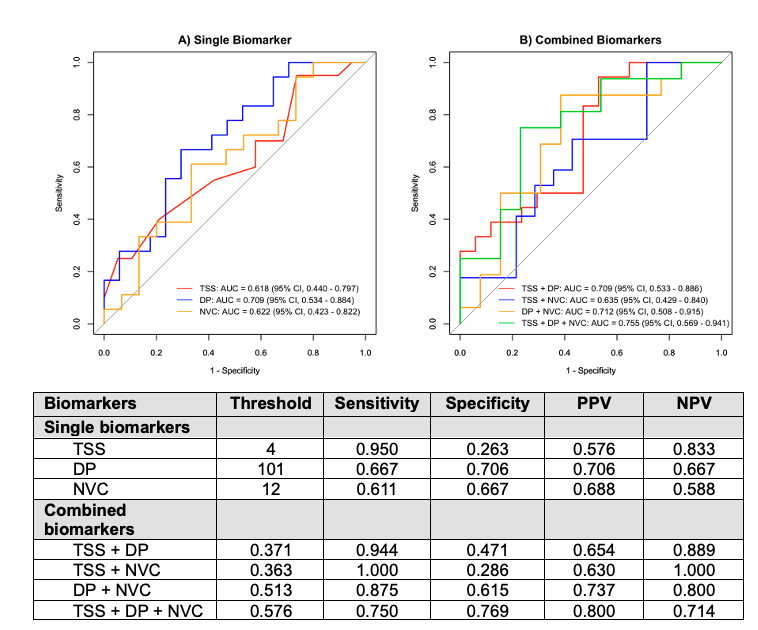 Figure 1. Receiver Operating Characteristic (ROC) Curves for Neurodevelopmental Impairment (NDI): Single Biomarker (A) and Combined Biomarkers (B). The Total Sarnat Score (TSS) was calculated using the modified Sarnat exam within the first six hours of life. EEG delta power (DP) was calculated at the cross-cerebral parietal electrodes (P3-P4). Neurovascular coupling (NVC) was calculated using wavelet coherence between amplitude-integrated EEG from central region electrodes (C3-C4) and cerebral tissue oxygen saturation (SctO2). The gray diagonal line represents the line of non-significance.
 Abbreviations: DOL = days of lifeFigure 1. Receiver Operating Characteristic (ROC) Curves for Neurodevelopmental Impairment (NDI): Single Biomarker (A) and Combined Biomarkers (B). The Total Sarnat Score (TSS) was calculated using the modified Sarnat exam within the first six hours of life. EEG delta power (DP) was calculated at the cross-cerebral parietal electrodes (P3-P4). Neurovascular coupling (NVC) was calculated using wavelet coherence between amplitude-integrated EEG from central region electrodes (C3-C4) and cerebral tissue oxygen saturation (SctO2). The gray diagonal line represents the line of non-significance.Abbreviations: DOL = days of life