485 - Effect of a Guidelines-Based Smartphone Asthma Action Plan for Adolescents with Uncontrolled Asthma
Sunday, April 27, 2025
8:30am – 10:45am HST
Publication Number: 485.4959
Tamara Perry, University of Arkansas for Medical Sciences College of Medicine, Little Rock, AR, United States; Ariel Berlinski, University of Arkansas for Med, Little Rock, AR, United States; Rita C.. Brown, Akron Children's Hospital, Little Rock, AR, United States; Kaymon C. Neal, Arkansas Children's Hospital, North Little Rock, AR, United States; Larry Simmons, University of Arkansas for Medical Sciences College of Medicine, Little Rock, AR, United States; Sarah A. Marshall, UAMS, Little Rock, AR, United States; Simon Chung, University of Arkansas for Medical Sciences College of Medicine, Little Rock, AR, United States; Andrew W. Brown, University of Arkansas for Medical Sciences, Little Rock, AR, United States; Xing He, University of Florida College of Medicine, Gainesville, FL, United States; Jiang Bian, University of Florida College of Medicine, Gainesville, FL, United States
Professor of Pediatrics and Chief of Allergy/Immunology University of Arkansas for Medical Sciences College of Medicine Little Rock, Arkansas, United States
Background: Mobile health (mHealth) applications have the potential to integrate health management into patients’ daily routines. We designed the Pulmonary Education and Asthma Knowledge mobile Asthma Action Plan (PEAKmAAP) to reduce morbidity among adolescents with uncontrolled persistent asthma. Objective: To examine the effectiveness of PEAKmAAP, a personalized and interactive mHealth smartphone application. Design/Methods: We conducted a 12-month randomized, controlled trial among adolescents with uncontrolled persistent asthma and baseline Asthma Control Test (ACT) score ≤19. Enrolled participants were randomized to: 1) PEAKmAAP, 2) PEAKmAAP plus data sharing (PEAKmAAP-DS) or 3) usual care (UC). Data-sharing (DS) included monthly reports to PCP of healthcare visits and app-generated symptom data. UC group used a nutrition application with daily non-asthma reminders. PEAKmAAP participants input daily asthma symptoms or peak flow then received real-time feedback according to their personalized AAP. PEAKmAAP provided asthma education videos and reminders for daily medications and to refill asthma controller medications monthly. Participants completed visits at baseline, 3, 6, 9 and 12 months. Proportion differences between groups were estimated for complete data with participants as assigned. Results: We randomized 365 adolescents, median age 14.2 years, 57% female, 71% Black, 7% Hispanic, and 84% public insurance. At 3-months (primary endpoint), 58% of PEAKmAAP participants (with or without DS) and 50% of UC participants had ACT >19 (difference: 7.5%, 95%CI: [-5%, 20%]). Across 3, 6, 9, and 12 months, the proportion of participants with ACT >19 in the PEAKmAAP groups was higher than UC, with the difference between groups reaching statistical significance at 12 months (difference: 18%, 95% CI: [4%,32%]; Figure 1). There was no difference in the proportion of participants with ACT >19 in the PEAKmAAP versus PEAKmAAP-DS groups across timepoints, nor the proportion of participants whose ACT score improved ≥3 between PEAKmAAP and UC groups (Figure 2).
Conclusion(s): Compared to UC, PEAKmAAP had no difference in the proportion of participants with ACT >19 at 3 months, but there was a significantly higher proportion of PEAKmAAP participants with ACT >19 at the end of the 12-month intervention. This predominantly minority adolescent population with uncontrolled asthma had long-term improvement in asthma control. Findings support the use of a personalized mHealth application to reduce morbidity among this high-risk group.
Proportion of Well Controlled Asthma Figure 1. Proportion of participants in the PEAKmAAP (with or without DS) and UC groups with ACT >19. The PEAKmAAP group had a higher proportion of participants with ACT >19 over the 12-month intervention period with a statistically significant difference by 12 months.
Proportion of ACT with ≥3-point increase in ACT 
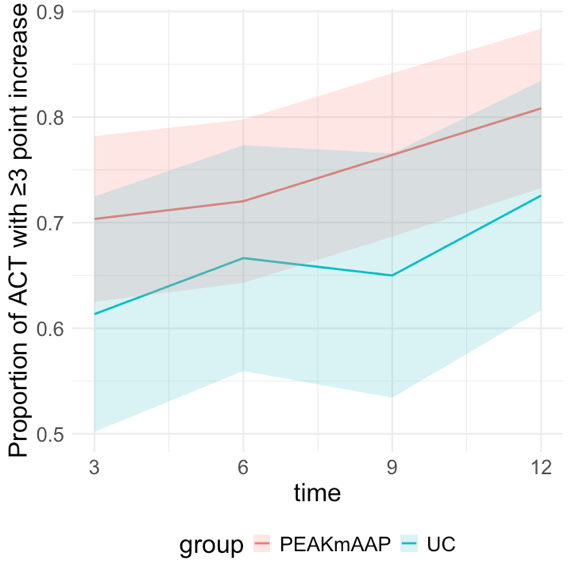
Figure 2. Proportion of participants with a clinically significant increase in ACT score (≥3-point increase compared to baseline) in the PEAKmAAP and UC groups. No statistically significant differences were seen between PEAKmAAP groups and UC.