
Nephrology 3
Session: Nephrology 3
Elif G. Bozkurt, MD (she/her/hers)
Research Fellow
Mayo Clinic Children's Center
Rochester, Minnesota, United States
.png) Variants were identified across a range of genes, including monoallelic or copy number changes in PKD1, PKD2, IFT140, NEK8, GANAB, PKHD1, TSC2, TSC2/PKD1, HNF1B, and ZMYM2, as well as biallelic variants in NPHP1 and TMEM67, and biallelic or suspected biallelic variants in PKHD1 associated with ARPKD phenotypes.
Variants were identified across a range of genes, including monoallelic or copy number changes in PKD1, PKD2, IFT140, NEK8, GANAB, PKHD1, TSC2, TSC2/PKD1, HNF1B, and ZMYM2, as well as biallelic variants in NPHP1 and TMEM67, and biallelic or suspected biallelic variants in PKHD1 associated with ARPKD phenotypes. 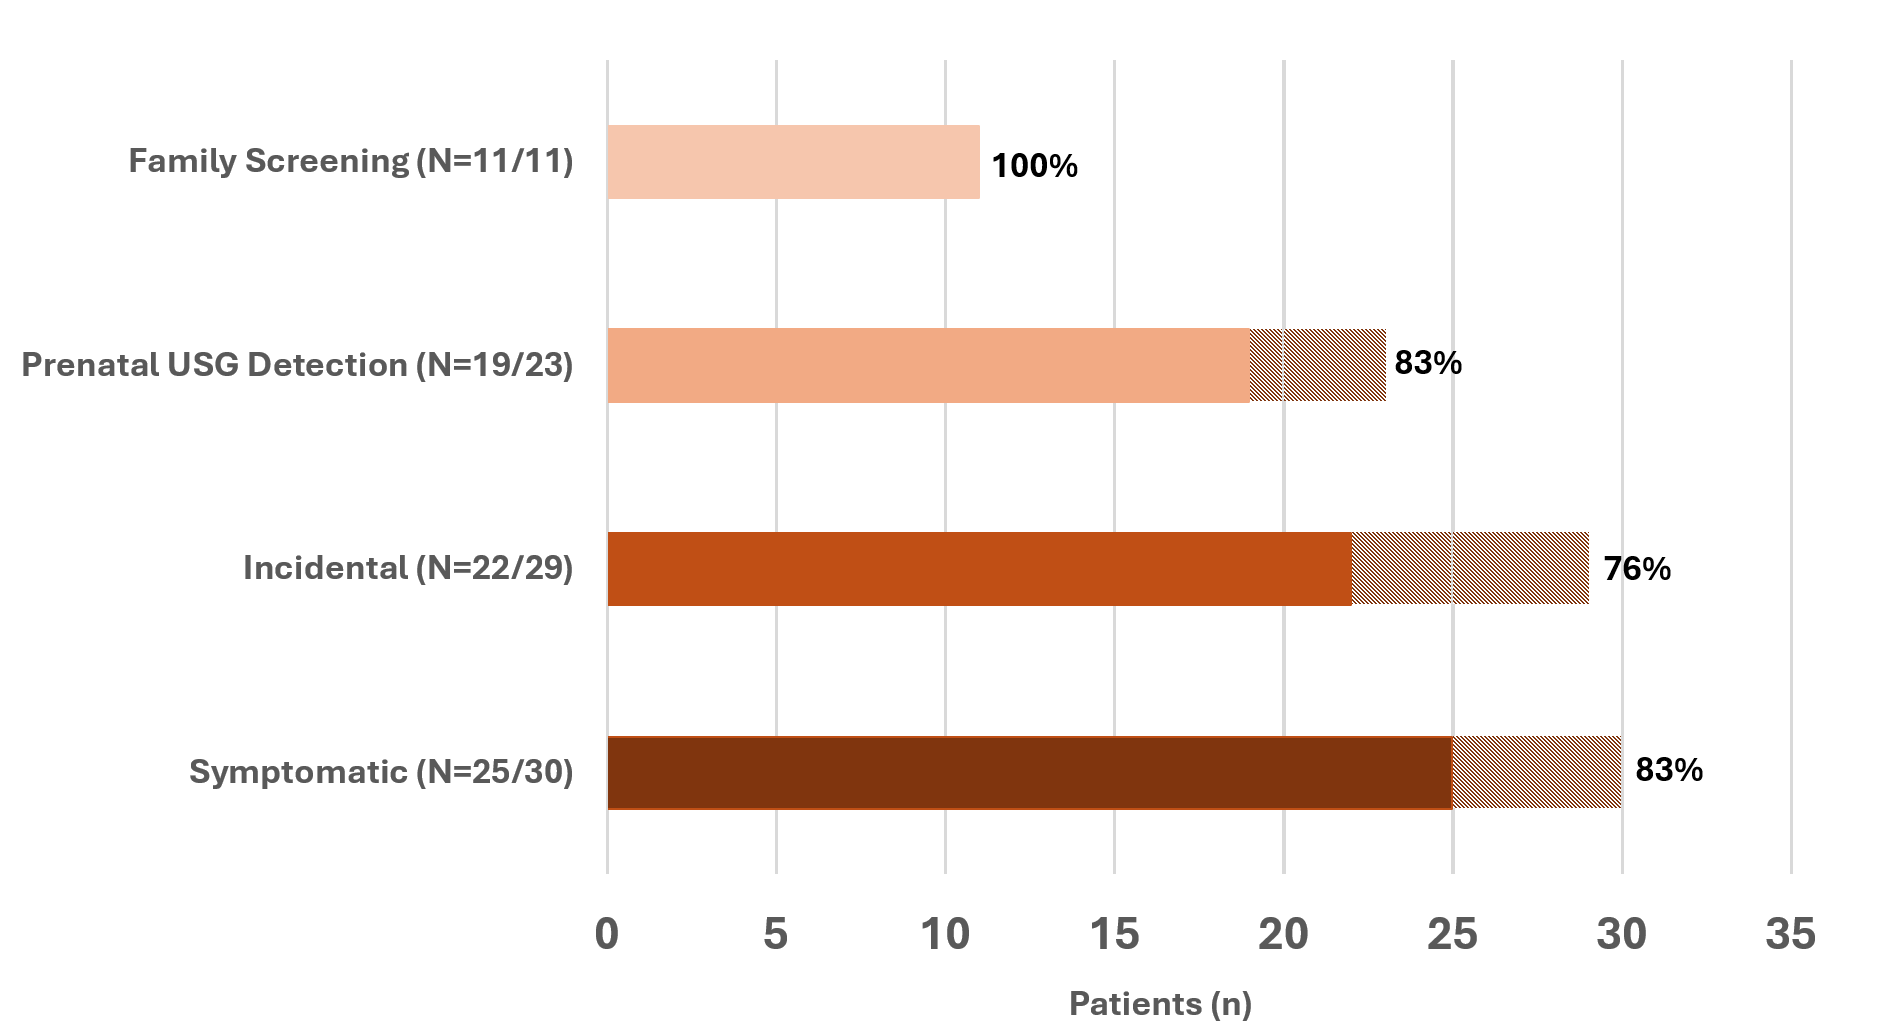 The y-axis categorizes initial presentation types: Family Screening, Prenatal Ultrasound (USG) Detection, Incidental, and Symptomatic. The x-axis shows the patient count. Solid-colored bars represent patients with resolved genetic diagnoses, with percentages indicating the resolution rate within each presentation type (Resolved patients, N=77). Dashed sections show the total number of patients tested per category (Tested patients, N=93).
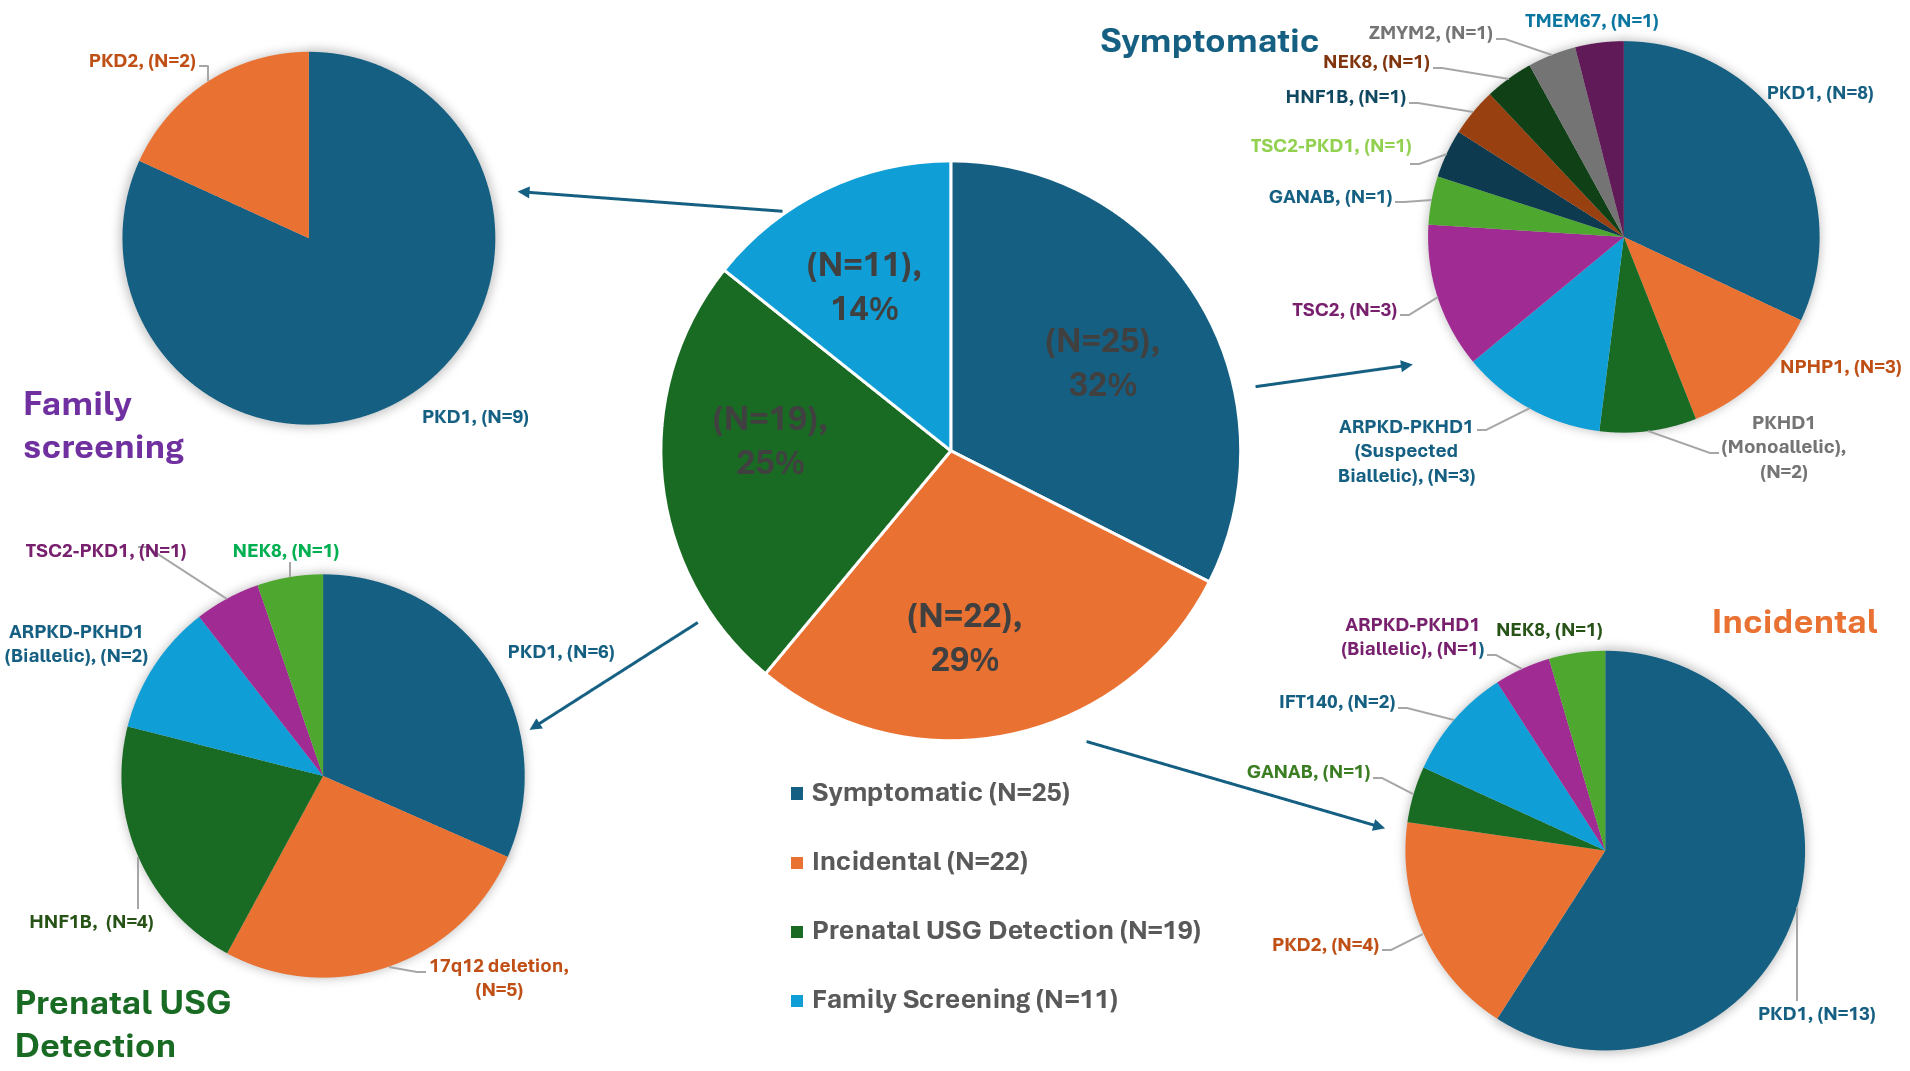 The central pie chart shows the distribution of resolved cases by initial presentation type: Symptomatic (32%), Incidental (29%), Prenatal Ultrasound Detection (25%), and Family Screening (14%). Each surrounding pie chart displays the distribution of causative genes for each presentation type. In Symptomatic cases, causative genes include PKD1, NPHP1, PKHD1 (monoallelic), suspected biallelic PKHD1 with ARPKD phenotype, TSC2, GANAB, TSC2-PKD1, HNF1B, NEK8, ZMYM2, and TMEM67. Incidental cases show PKD1, PKD2, GANAB, IFT140, PKHD1 (biallelic), and NEK8 as causative genes. Prenatal screening cases involve PKD1, 17q12 deletion, HNF1B, PKHD1 (biallelic), TSC2-PKD1, and NEK8. Family screening cases primarily feature PKD1 and PKD2.Variants were identified across a range of genes, including monoallelic or copy number changes in PKD1, PKD2, IFT140, NEK8, GANAB, PKHD1, TSC2, TSC2/PKD1, HNF1B, and ZMYM2, as well as biallelic variants in NPHP1 and TMEM67, and biallelic or suspected biallelic variants in PKHD1 associated with ARPKD phenotypes. The y-axis categorizes initial presentation types: Family Screening, Prenatal Ultrasound (USG) Detection, Incidental, and Symptomatic. The x-axis shows the patient count. Solid-colored bars represent patients with resolved genetic diagnoses, with percentages indicating the resolution rate within each presentation type (Resolved patients, N=77). Dashed sections show the total number of patients tested per category (Tested patients, N=93).The central pie chart shows the distribution of resolved cases by initial presentation type: Symptomatic (32%), Incidental (29%), Prenatal Ultrasound Detection (25%), and Family Screening (14%). Each surrounding pie chart displays the distribution of causative genes for each presentation type. In Symptomatic cases, causative genes include PKD1, NPHP1, PKHD1 (monoallelic), suspected biallelic PKHD1 with ARPKD phenotype, TSC2, GANAB, TSC2-PKD1, HNF1B, NEK8, ZMYM2, and TMEM67. Incidental cases show PKD1, PKD2, GANAB, IFT140, PKHD1 (biallelic), and NEK8 as causative genes. Prenatal screening cases involve PKD1, 17q12 deletion, HNF1B, PKHD1 (biallelic), TSC2-PKD1, and NEK8. Family screening cases primarily feature PKD1 and PKD2.