015 - Using Visualizations to Convey Complex Health Information to Youth Kidney Transplant Recipients
Sunday, April 27, 2025
8:30am – 10:45am HST
Publication Number: 15.7087
Chelsea Ng, Seattle Children's, Seattle, WA, United States; Julia C.. Dunbar, Seattle Children's, Shoreline, WA, United States; Sanaa Syed, Seattle Children's, Seattle, WA, United States; Nathan Y. Pan, Seattle Children's, Sammamish, WA, United States; Jodi Smith, University of Washington School of Medicine, Seattle, WA, United States; Ari Pollack, University of Washington School of Medicine, Seattle, WA, United States
Clinical Research Coordinator Seattle Children's Hospital Seattle, Washington, United States
Background: Youth kidney transplant recipients and caregivers struggle to understand complex health information, such as kidney function (KF) values (e.g. creatinine), limiting their ability to effectively engage and participate in their care. Information visualizations such as visual analogies, a representation that highlights the similarities between two different ideas through visual means, can support understanding of abstract data and present complex information that facilitates and improves self-management. Objective: Design and evaluate a novel visualization to support the information needs of youth kidney transplant recipients and caregivers, with the goal of increasing accessible knowledge for self-management. Design/Methods: We conducted two studies with youth kidney transplant recipients and their caregivers: (1) identify effective visualization strategies that support patient information needs and (2) evaluate a new Kidney Function Visualization (KFV) informed by Study 1. In Study 1, participants (English & Spanish speaking) drew representations of their kidney function over time via remote design sessions. These findings informed the development of the novel KFV. In Study 2, participants interacted with the personalized (using EHR data) KFV for one week, then completed an interview exploring how the KFV impacted reflection and self-management. Design sessions and interviews were recorded, transcribed, and analyzed using content analysis (Study 1), thematic analysis, and affinity diagramming (Study 2). Results: Participant details are in Table 1. In Study 1, youth and caregivers consistently described the difficulty of understanding their creatinine results and related medical terminology, with the majority using emotions to represent their KF (Table 2). Therefore, our KFV, a visual analogy, used emotions and colors, correlating with their creatinine and GFR (Fig 1). For many participants, the KFV (1) mirrored and validated their emotions, prompting reflections on their KF, contextualized by their lived experiences, (2) served as a progress check, and (3) acted as a motivator for healthy kidney care habits.
Conclusion(s): Kidney function lab values, although seemingly straightforward in their intended purpose and use, are more complex from the patient and family perspective, as they also closely align with their emotions. Our study demonstrates the value of designing visualizations that capture these complexities, which can create opportunities for bi-directional communication with clinicians to uncover patient values and preferences and ultimately facilitate self-management.
Table 1 
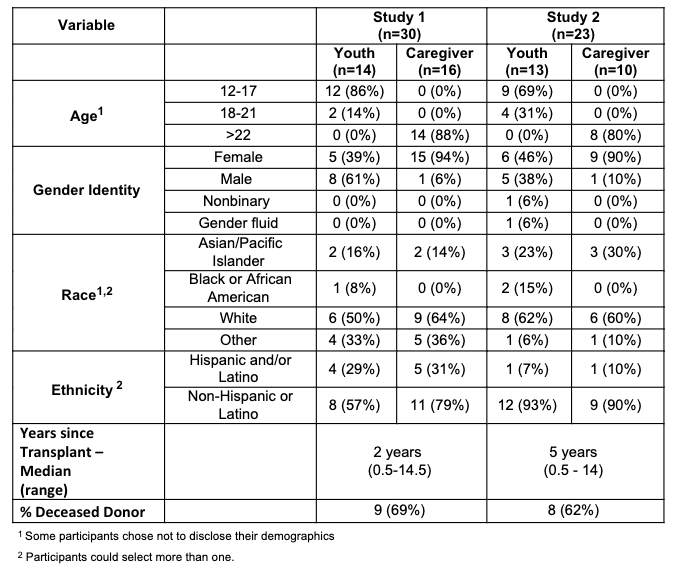
Participant demographics
Table 2 
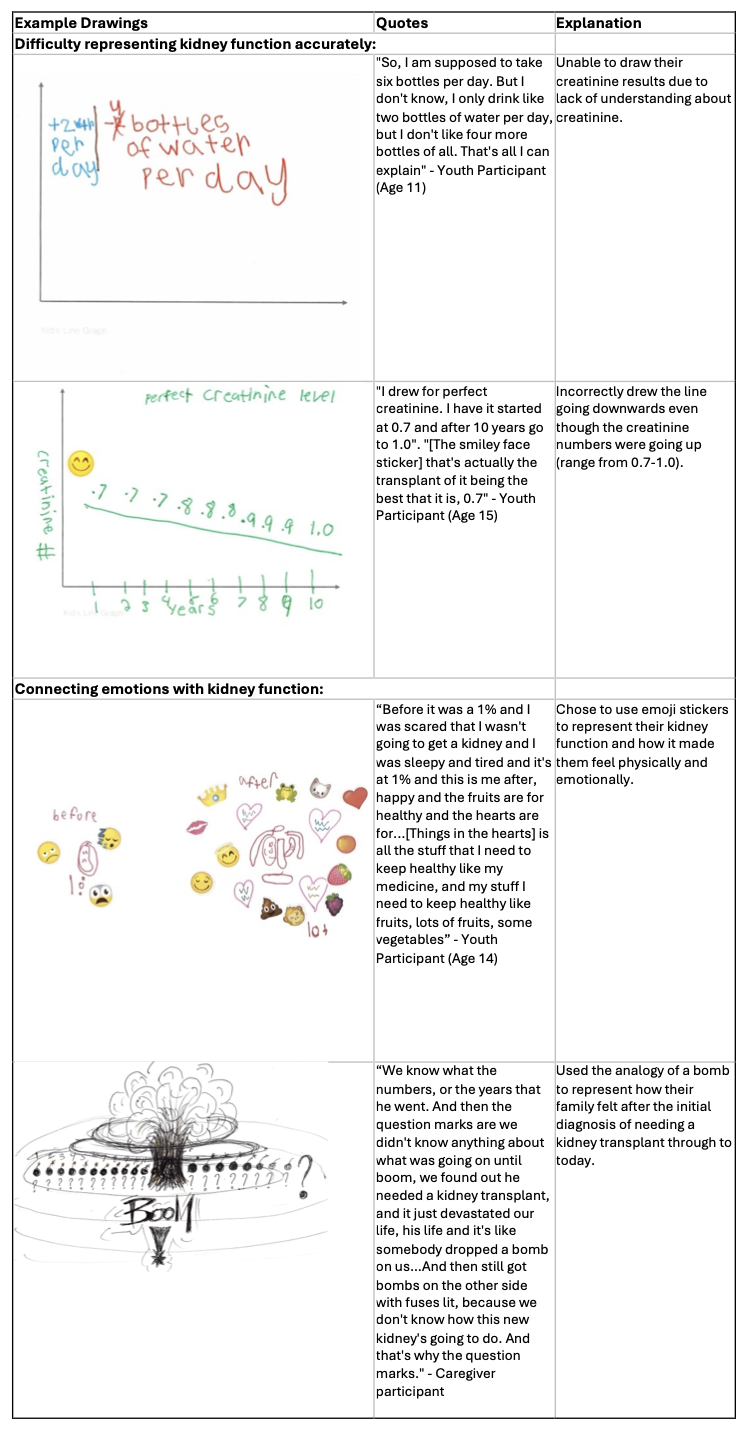
Examples of caregiver and youth drawings kidney function drawings and descriptions
Figure 1 
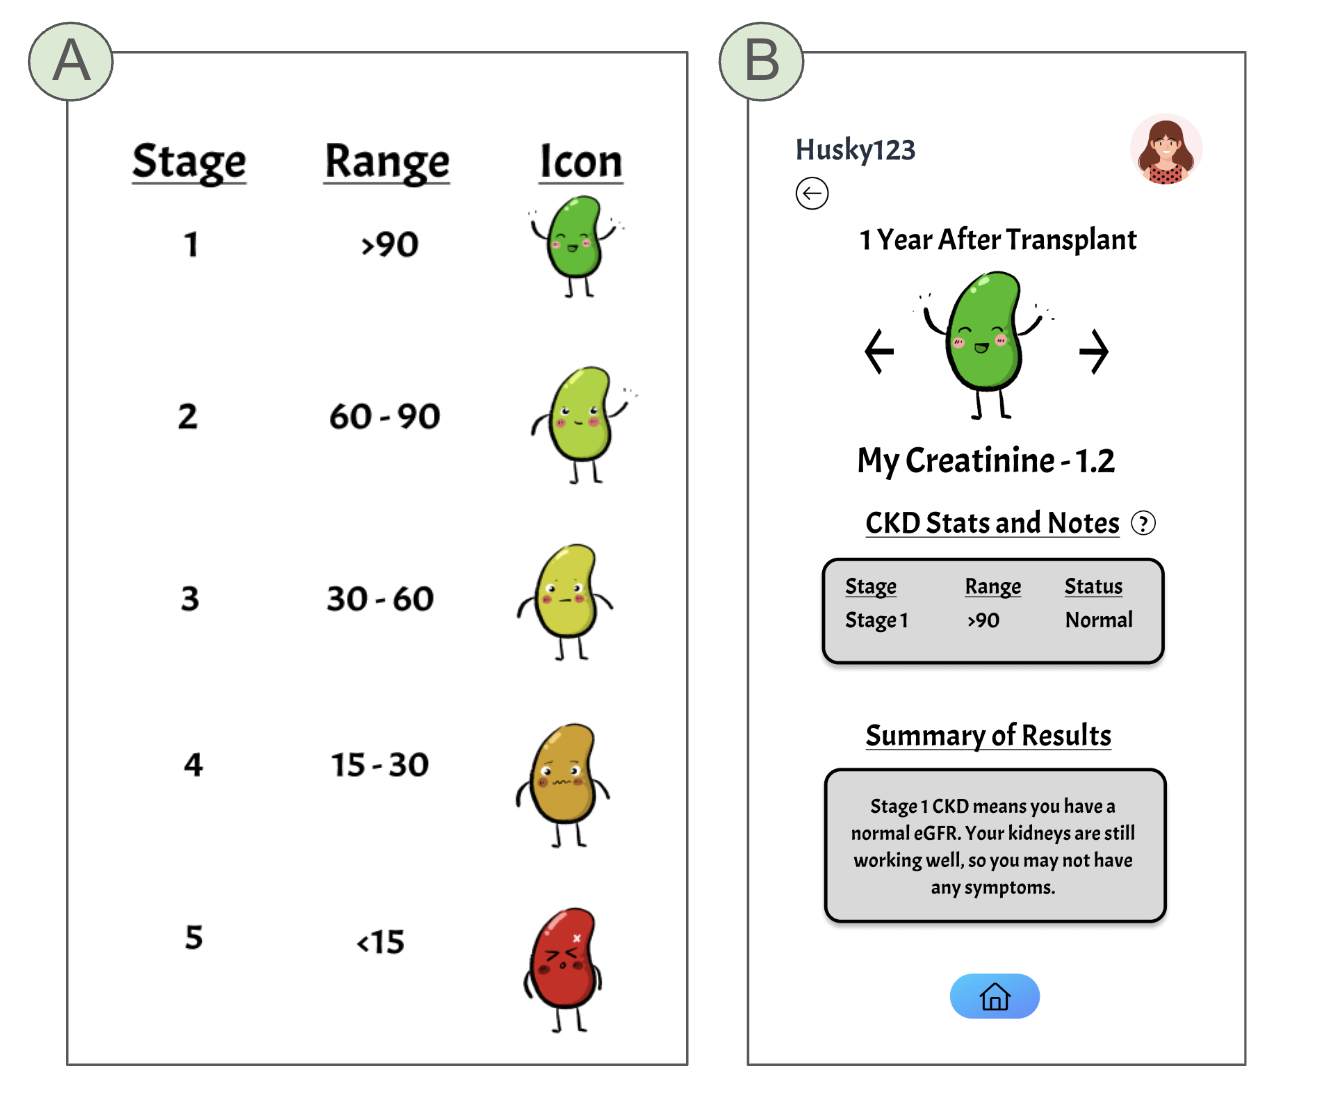
(a) Kidney Function Visualization (KFV) key with visuals and corresponding CKD stage & GFR ranges (b) KFV with personalized data and descriptions