
Neonatal Neurology 5: Fetal
Session: Neonatal Neurology 5: Fetal
 photo")
Pranav K. Viswanathan, Bachelor of Science (he/him/his)
Medical Student
University of Texas Southwestern Medical School
Georgetown, Texas, United States
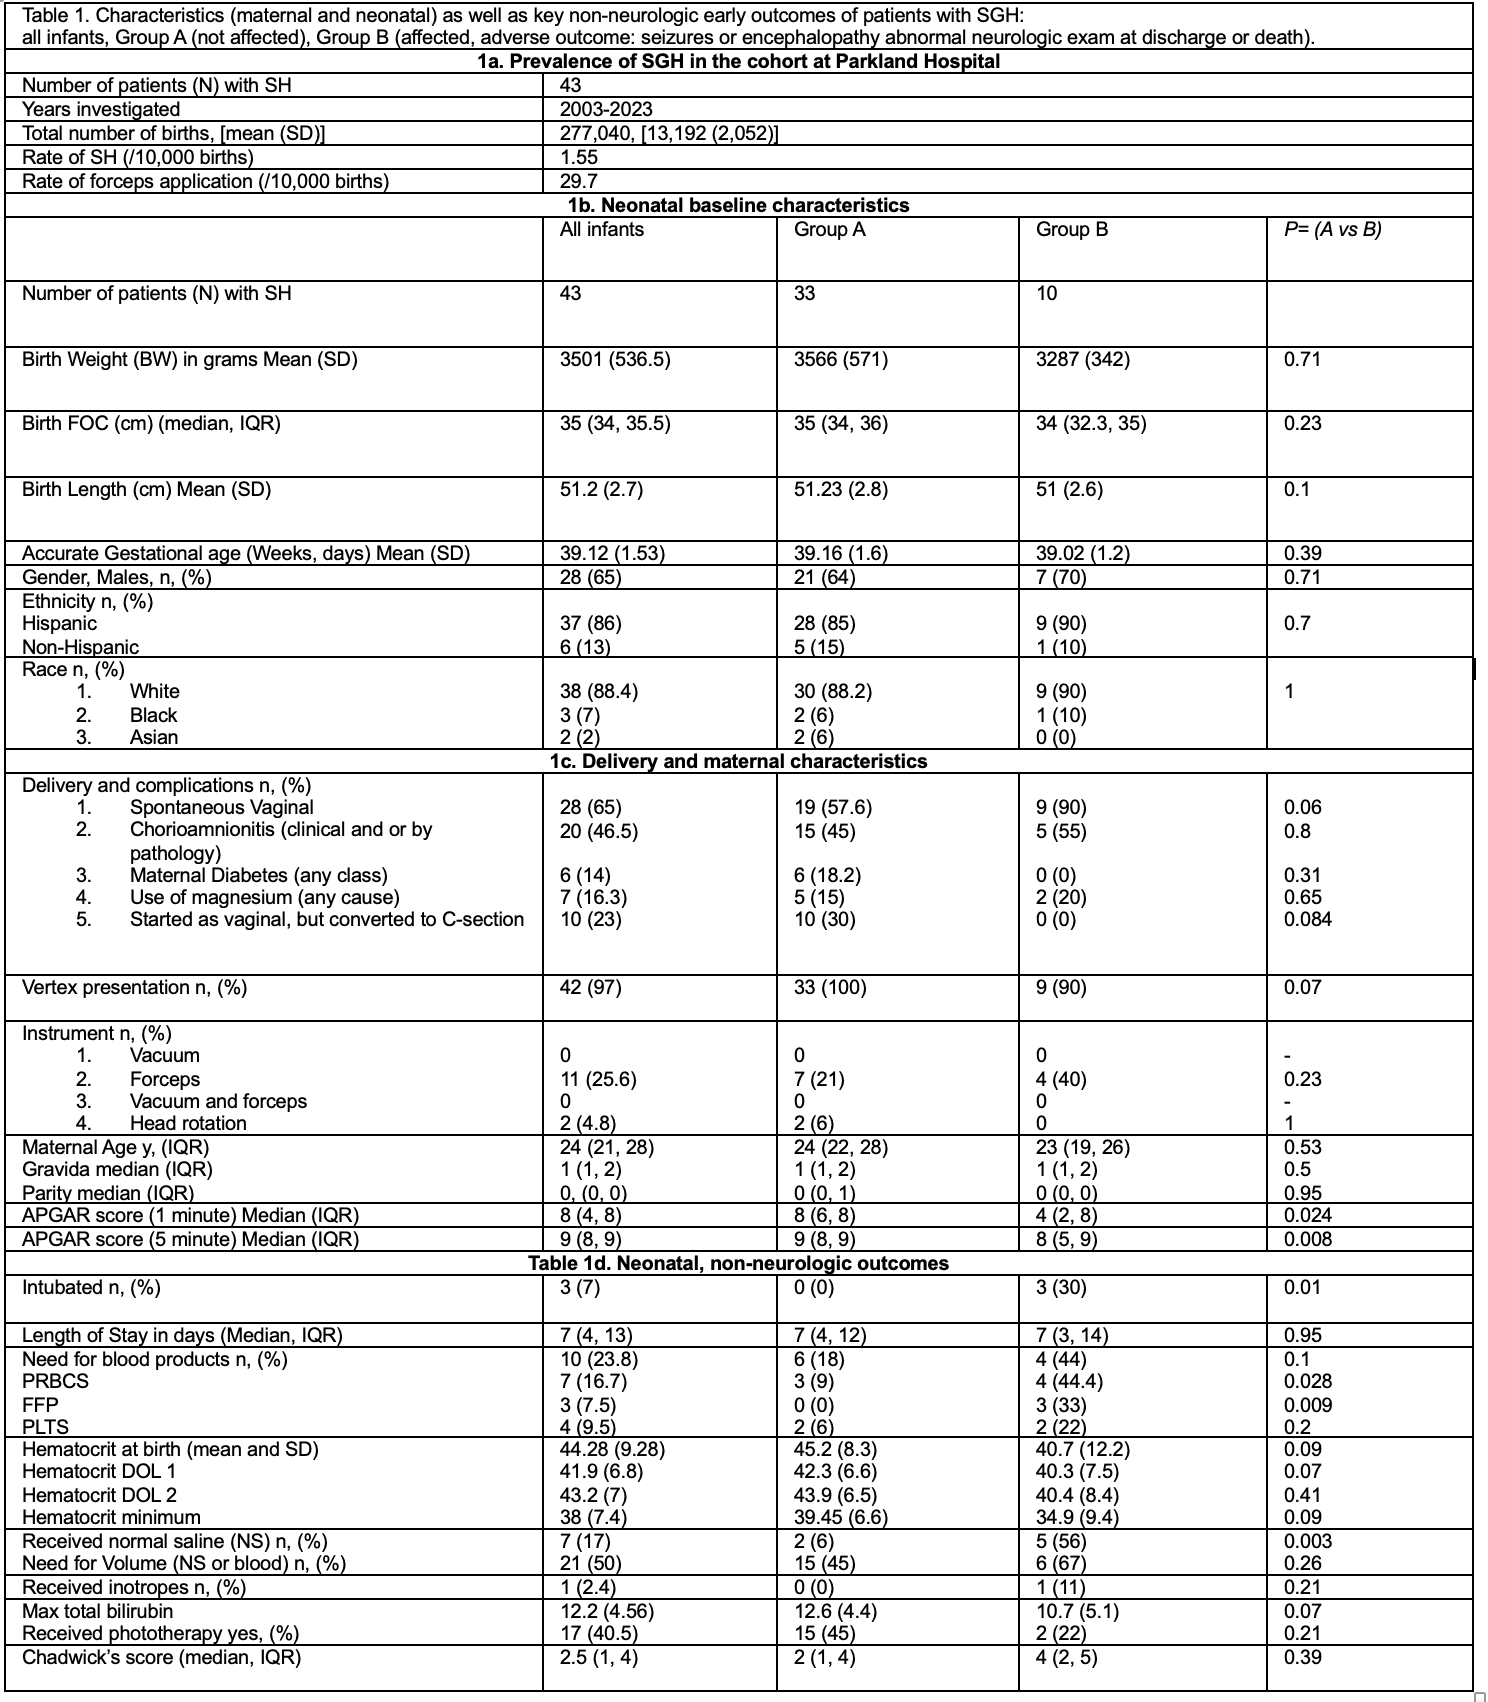 Table 1. Baseline Rates of SGHs and forceps (1a), comparison of baseline maternal and neonatal characteristics (1b, 1c), Early non-neurologic relevant to SGH outcomes in this cohort (1d).
 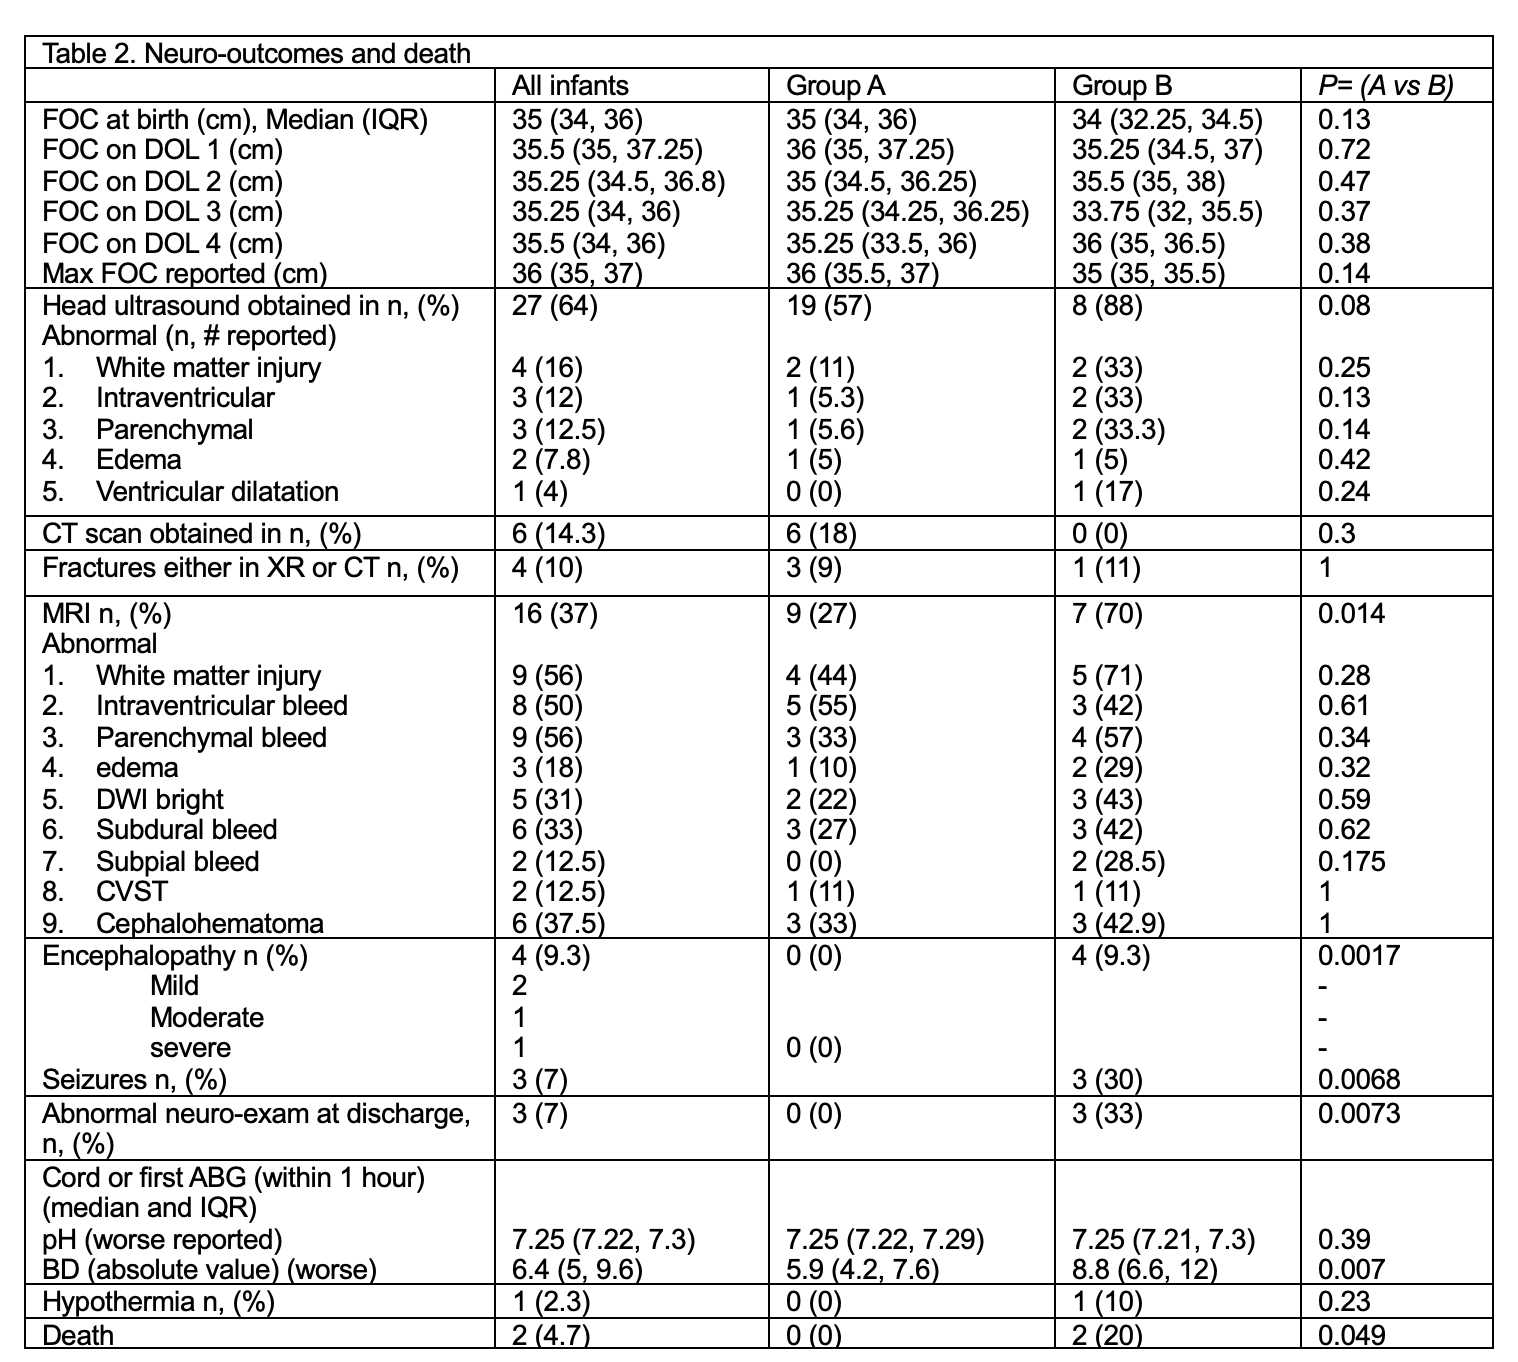 Table 2. Neurologic outcomes and death rate, relevant to SGH.
 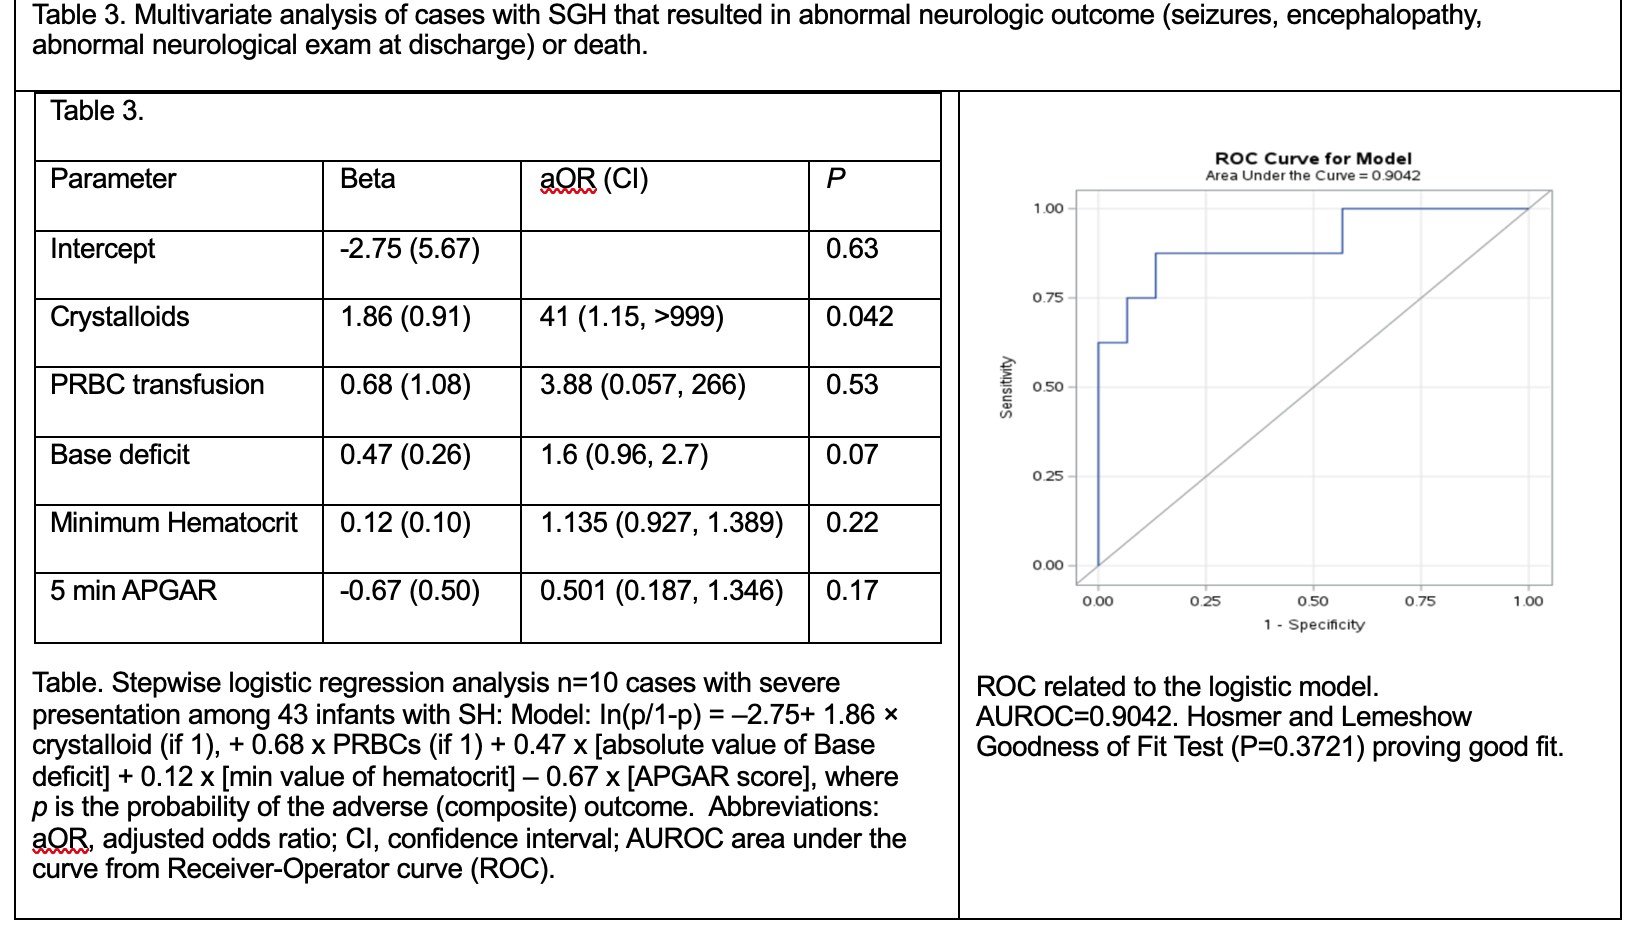 Table. Stepwise logistic regression analysis n=10 cases with severe presentation among 43 infants with SH: Model: In(p/1-p) = –2.75+ 1.86 × crystalloid (if 1), + 0.68 x PRBCs (if 1) + 0.47 x [absolute value of Base deficit] + 0.12 x [min value of hematocrit] – 0.67 x [APGAR score], where p is the probability of the adverse (composite) outcome. Abbreviations: aOR, adjusted odds ratio; CI, confidence interval; AUROC area under the curve from Receiver-Operator curve (ROC). ROC related to the logistic model. AUROC=0.9042. Hosmer and Lemeshow Goodness of Fit Test (P=0.3721) proving good fit.