Health Equity/Social Determinants of Health 6
Session: Health Equity/Social Determinants of Health 6
728 - Geospatial exploration of social determinants of health, childhood obesity, and school outdoor space among Latino communities
Sunday, April 27, 2025
8:30am - 10:45am HST
Publication Number: 728.5015
Joseph C. Cleveland, University of Colorado School of Medicine, Denver, CO, United States; Payal Shah, Children’s hospital Los Angeles, Los angeles, CA, United States; Alexis Deavenport-Saman, Children's Hospital Los Angeles; USC Keck School of Medicine, Los Angeles, CA, United States; Larry Yin, Keck School of Medicine/Children’s Hospital Los Angeles, Los Angeles, CA, United States; Tanya L. Alderete, Johns Hopkins University, Baltimore, MD, United States; Juan C. Espinoza, Ann & Robert H. Lurie Children's Hospital of Chicago, Chicago, IL, United States
.jpg)
Joseph C. Cleveland, III, BS (he/him/his)
Medical Student
University of Colorado School of Medicine
Denver, Colorado, United States
Presenting Author(s)
Background: Children with obesity are at increased risk of experiencing adverse health, psychosocial, and financial outcomes. Disparities in obesity begin early; Latino school-age children are 1.7 times more likely to have obesity than non-Hispanic white children. Accessible outdoor spaces play a role in both preventing and addressing pediatric obesity. Most analyses of outdoor space have been done at the neighborhood level, but children spend a significant amount of time in school. There is a lack of research on the relationship between school outdoor spaces and childhood obesity, how they relate to community-level social determinants of health (SDoH), and to obesity related disparities among Latino communities.
Objective: To examine SDoH, childhood fitness, and school outdoor space among Latino communities in the Los Angeles Unified School District (LAUSD).
Design/Methods: School fitness data for 5th graders from 571 schools was taken from the FITNESSGRAM® Physical Fitness Test report. All schools were ranked based on the percent of students with a BMI between 5th-85th %ile for age and sex. This was used to create quartiles; the top quartile or “High fitness group (HFG)” and the bottom quartile or “Low fitness group (LFG)” had their total area of outdoor recreational space calculated (in m2) using a geospatial aerial map-based polygon construction (280 total schools). The Healthy Places Index 2.0 (HPI) was used as a marker of SDoH in the area surrounding a school. School data was taken from the California department of education website.
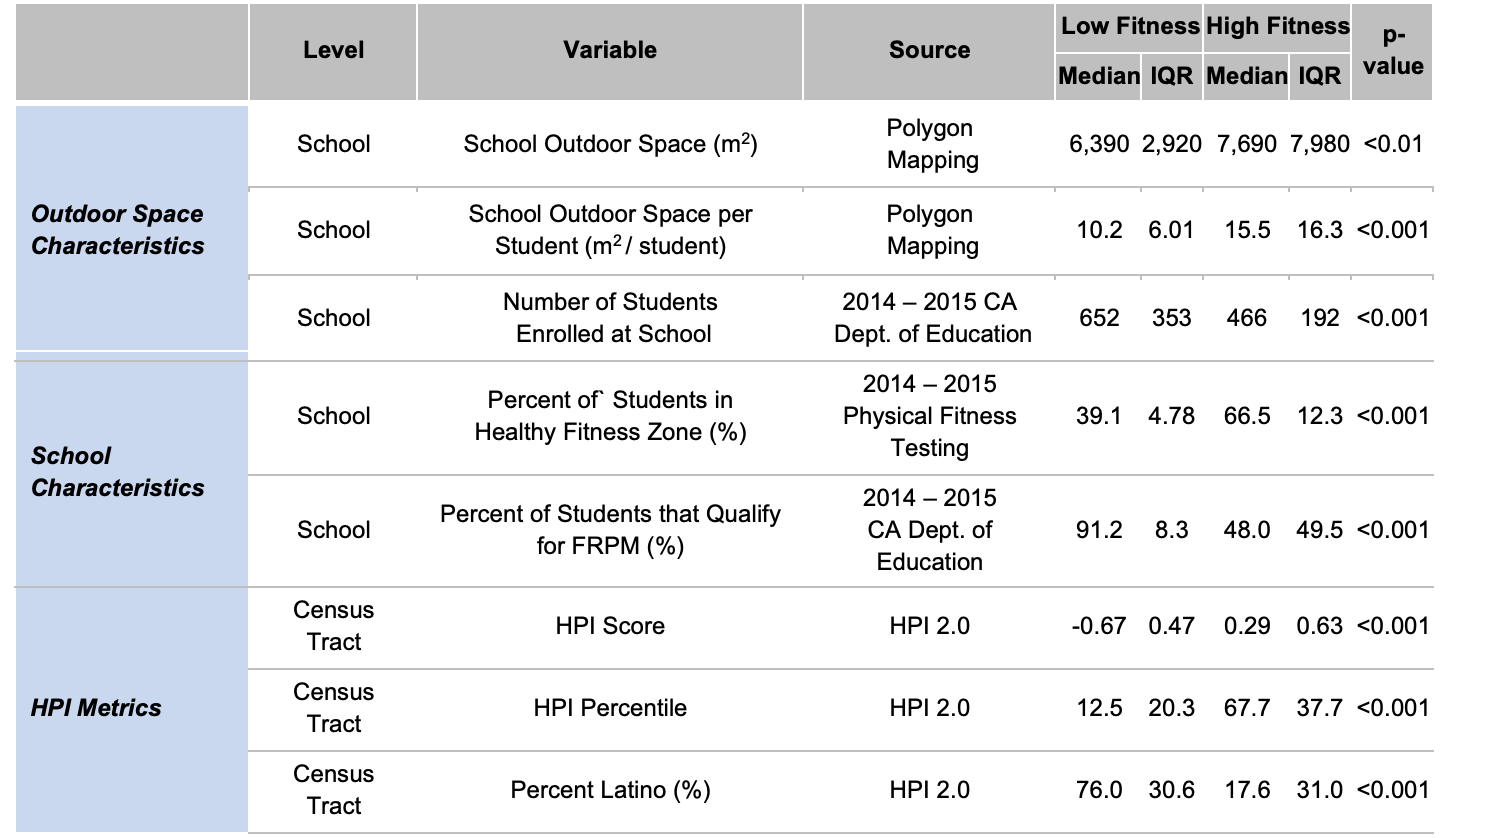
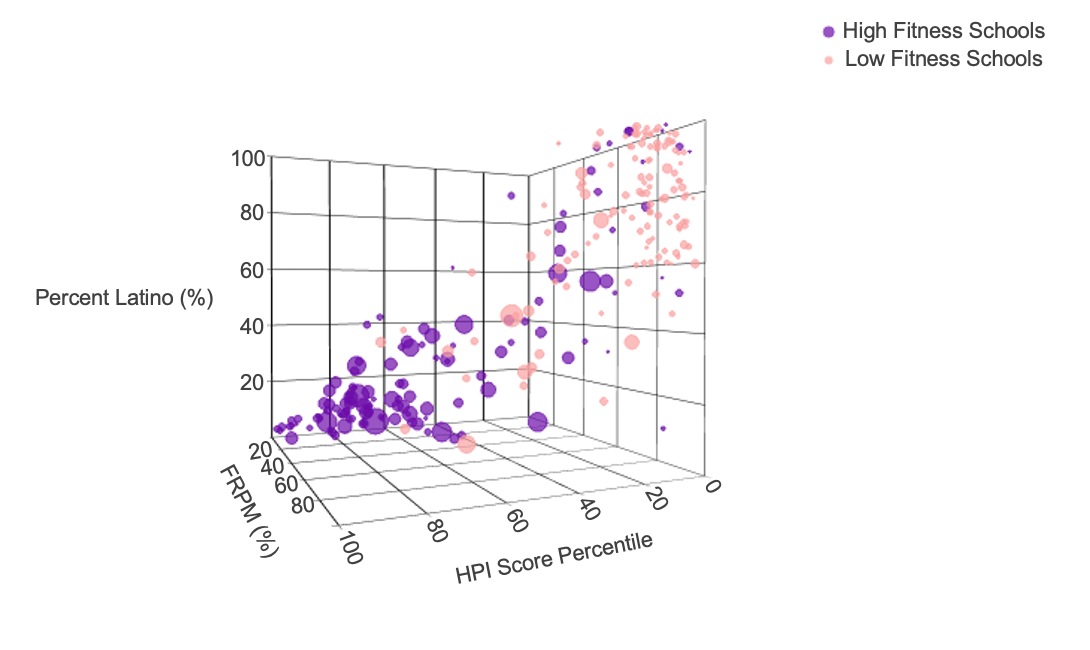
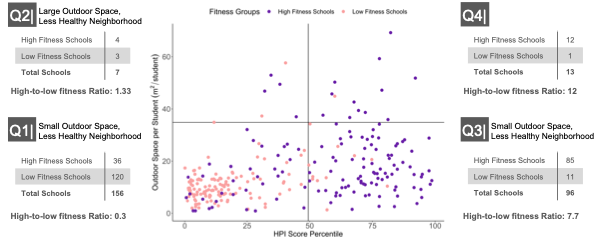
Results: Schools in the LFG were located in neighborhoods with higher percentages of Latinos (76% vs 17.6%), reported higher number of students (652 vs 466, p< 0.001), had less median outdoor space per student (10.2 vs 15.5 m2, p< 0.001), represented a greater percentage of students qualified for free or reduced price meals (FRPM) (91.2% vs 48.0%, p< 0.001), and were located in neighborhoods with a lower HPI percentile (12.5 vs 67.7, p< 0.001) compared to HFG (Table 1, Figure 1). Figure 2 shows the relationship between student fitness, available outdoor space, and HPI scores.
Conclusion(s): Increased school outdoor space is correlated with both higher fitness rates and lower levels of health-related adversity (as represented by the HPI). Latino communities are particularly impacted by these disparities. These findings should be leveraged by policymakers and school leaders to explore opportunities to improve existing and planned outdoor school spaces as a component of comprehensively addressing childhood obesity.
Table 1: Social Determinants of Health (SDoH) variables by High Fitness Group & Low Fitness Group
 FRPM: Free-or-reduced-price meals; HPI: Healthy Places Index 2.0
Figure 1: Low Fitness Schools have a greater proportion of students that qualify for free-or-reduced (FRPM) lunch, a greater proportion of Latino students, and are located in communities with more adverse social determinants of health (SDoH)
 Each dot on this scatterplot represents a school. The diameter of the dots indicates the measured amount of available outdoor space per student at that school. Larger dots indicate schools with a higher level of available outdoor space / student. The x-axis represents Healthy Places Index 2.0 (HPI) Score Percentile with 0 representing the schools in communities with the most adverse SDoH and 100 representing schools in communities with the least adverse SDoH present. The y-axis represents the Percent of Students that Qualify for Free-or-Reduced Price Meals (FRPM) at each school with 0 representing schools in which no students qualify for FRPM and 100 representing schools in which all students qualify for FRPM. The z-axis represents the Percent Latino (%) of census tract in which the school is located, with 0 representing census tracts with 0% of population identifying as Latino and 100 representing census tracts with 100% of population identifying as Latino.
 Figure 2: Proportion of High Fitness and Low Fitness Schools Relative to Outdoor Space and HPI Scores
 Outdoor Space per Student (m2 / student) is captured on the y-axis. On the x-axis, HPI Score Percentile is captured. Each dot represents a school. Pink dots indicate schools in the Low Fitness Group and purple dots indicate schools in the High Fitness Group. The graph is broken up into four quadrants; from bottom to top and left to right, Q1 indicates schools with low levels of outdoor space / student and low HPI scores, indicating these schools are located in neighborhoods with more adverse SDoH. Q2 indicates schools with high levels of outdoor space / student and low HPI scores. Q3 indicates schools with lower levels of outdoor space and high HPI scores and Q4 indicates schools with high levels of outdoor space and low HPI scores. The number is each quadrant reflects the fraction of high fitness schools to low fitness schools. For example, in Q2, there are 1.33 high fitness schools for each low fitness school. Lower numbers indicate greater amounts of low fitness schools in a quadrant while high numbers indicate greater number of high fitness schools in a quadrant.
