399 - Geospatial Safety Analysis: The Impact of Child Opportunity on Drowning Hot Spots in North Texas.
Sunday, April 27, 2025
8:30am - 10:45am HST
Publication Number: 399.4809
Kevin C. Rix, University of Texas Health Science Center at Houston, Dallas, TX, United States; Rakima Parson, University of Texas Health Science Center, Dallas, TX, United States; Marianne Olaniran, University of Texas Health Science Center at Houston School of Public Health, Dallas, TX, United States; Connor M. Russell, University of Texas Southwestern Medical School, Forney, TX, United States; David C. Aguilar, Children's Health, Dallas, TX, United States; Jesus Alderete, Childrens, Dallas, TX, United States; Marisa Abbe, Children's Health, Dallas, TX, United States
Assistant Professor University of Texas health Science Center at Houston Dallas, Texas, United States
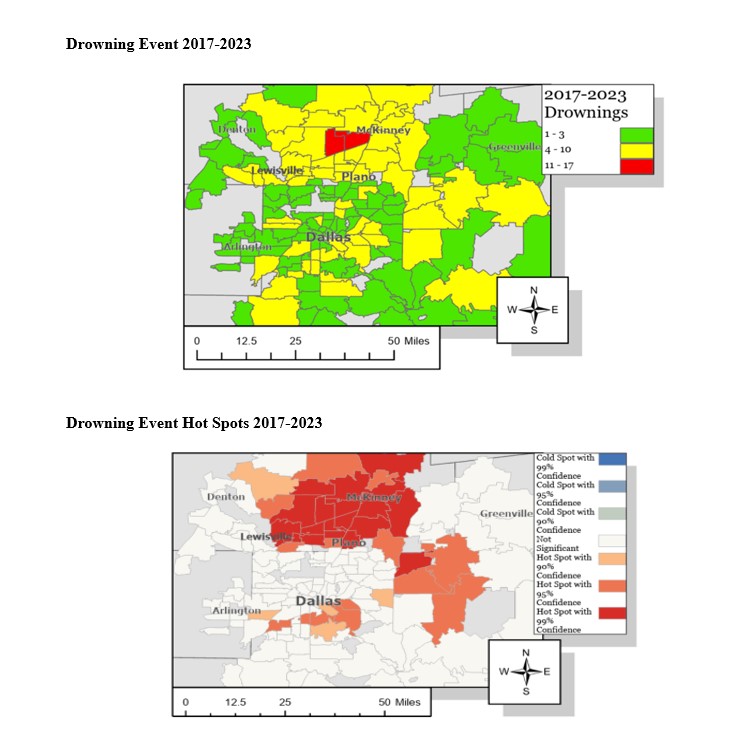
Background: Drowning is a preventable event in pediatric populations. The rate for fatal drowning events was 1.1 per 100,000 for those 0-17 years of age. In comparison to other mechanisms of unintentional injury, nonfatal drowning events often result in a four times greater rate of hospitalization. In order to prevent drownings in the future, we we need to understand both individual and environmental factors. One metric to capture both individual and environmental risk factors for adverse health outcomes is using the Child Opportunity Index (COI). In this study we utilized COI to examine how opportunity level influenced odds of drowning events in these communities. Objective: To explore the relationship between COI and Drowning events in North Texas. Design/Methods: This retrospective cohort study examined a sample of patients (N=510) from 148 unique zip codes who presented to the Children’s Health System Emergency Department, located in Dallas, Texas from 2017-2023. Patients were ages 0-17 years old and were identified using ICD10-CM codes. Very Low and Low COI levels were combined, High and Very High COI levels were combined and Moderate COI was used as the reference. Drowning event locations were geocoded and matched with their respective COI levels by Zip Code. Getis-Ord GI analysis was conducted to assess hot spot areas of drowning patients between 2017-2023. Drowning events were dichotomized to hot spot (95% or confidence or above) or non-hot spot, as there were no cold spots. Descriptive differences were assessed using Fisher’s exact tests and chi-square. Logistic regressions were conducted across COI indicators which included odds ratios and adjusted odds ratios. Results: Thirty-three zip codes in North Texas were identified as drowning event hot spots during the time period, primarily north of Dallas. Hot spot patients compared to non-hot spot patients only differed by race and were more often white (44.6% vs. 33.6% p=.01). Factors such as sex, drowning location, mortality, and supervision were not significant. Communities of higher overall COI had significantly increased odds in drowning events overall COI levels (aOR=6.5, p< 0.001 CI:3.5-12.1), while communities communities of low COI had an insignificant relationship (aOR=1.1 p=.71 CI .58-2.2) compared to moderate communities.
Conclusion(s): No one is immune to drowning. Children who live within communities with a higher COI were at increased odds of experiencing a drowning event. Social and environmental conditions in these communities may increase a child’s odds of drownings and drowning prevention efforts and future research should explore these further.
Patient Demographics
Adjusted COI Indicators and Patients in Drowning Hot Spots

.jpg)