
Emergency Medicine 9
Session: Emergency Medicine 9
 photo")
Alexandra H. Baker, MD (she/her/hers)
Assistant Professor of Pediatrics
Harvard Medical School
Boston Children's Hospital Department of Pediatrics
Sharon, Massachusetts, United States
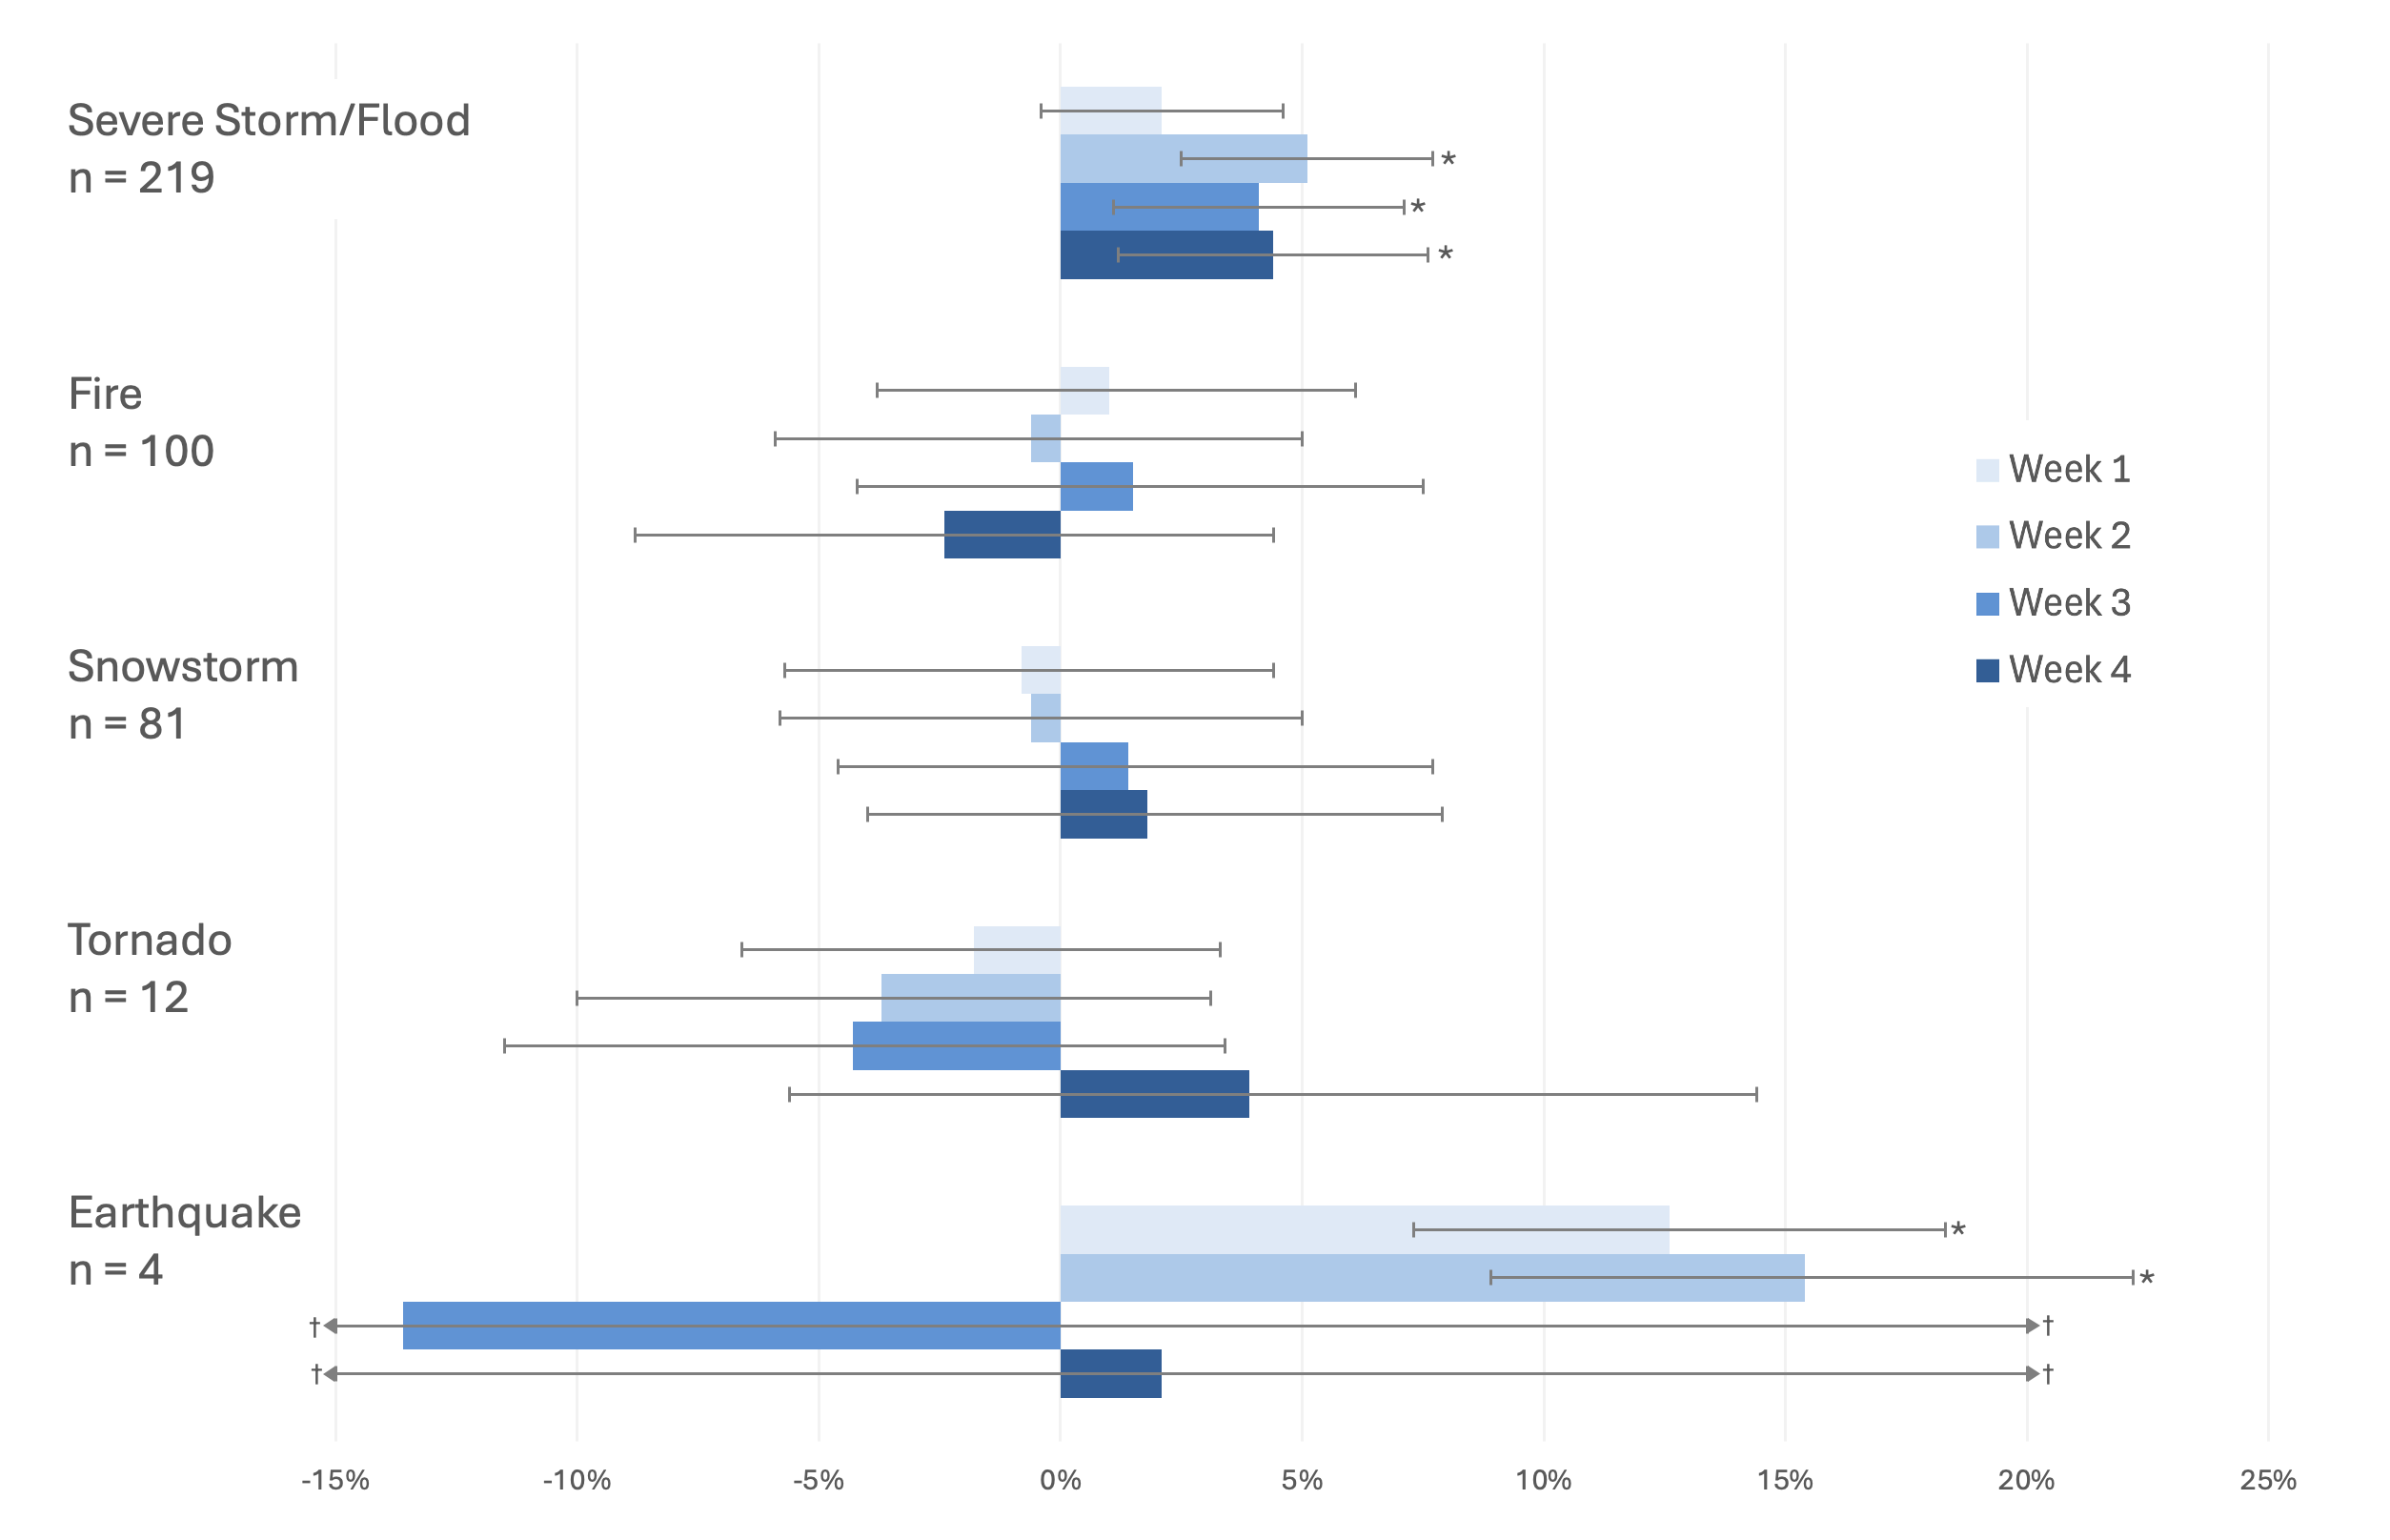 Figure 1. Percent change in ED volume by hospital, with 95% confidence intervals, after FEMA disaster declaration by disaster type. Baseline is the ED volume the week prior to the disaster declaration. Week 1 includes day of disaster declaration. n = disaster declaration/affected hospital combinations. * p<0.05. † CIs extend off graph.
 .png) Figure 2. Percent change in hospital admission from the ED by hospital, with 95% confidence intervals, after (FEMA) disaster declaration by disaster type. Baseline is the number of hospital admissions the week prior to the disaster declaration. Week 1 includes day of disaster declaration. n = disaster declaration/affected hospital combinations. * p<0.05. † CIs extend off graph.
Figure 2. Percent change in hospital admission from the ED by hospital, with 95% confidence intervals, after (FEMA) disaster declaration by disaster type. Baseline is the number of hospital admissions the week prior to the disaster declaration. Week 1 includes day of disaster declaration. n = disaster declaration/affected hospital combinations. * p<0.05. † CIs extend off graph. 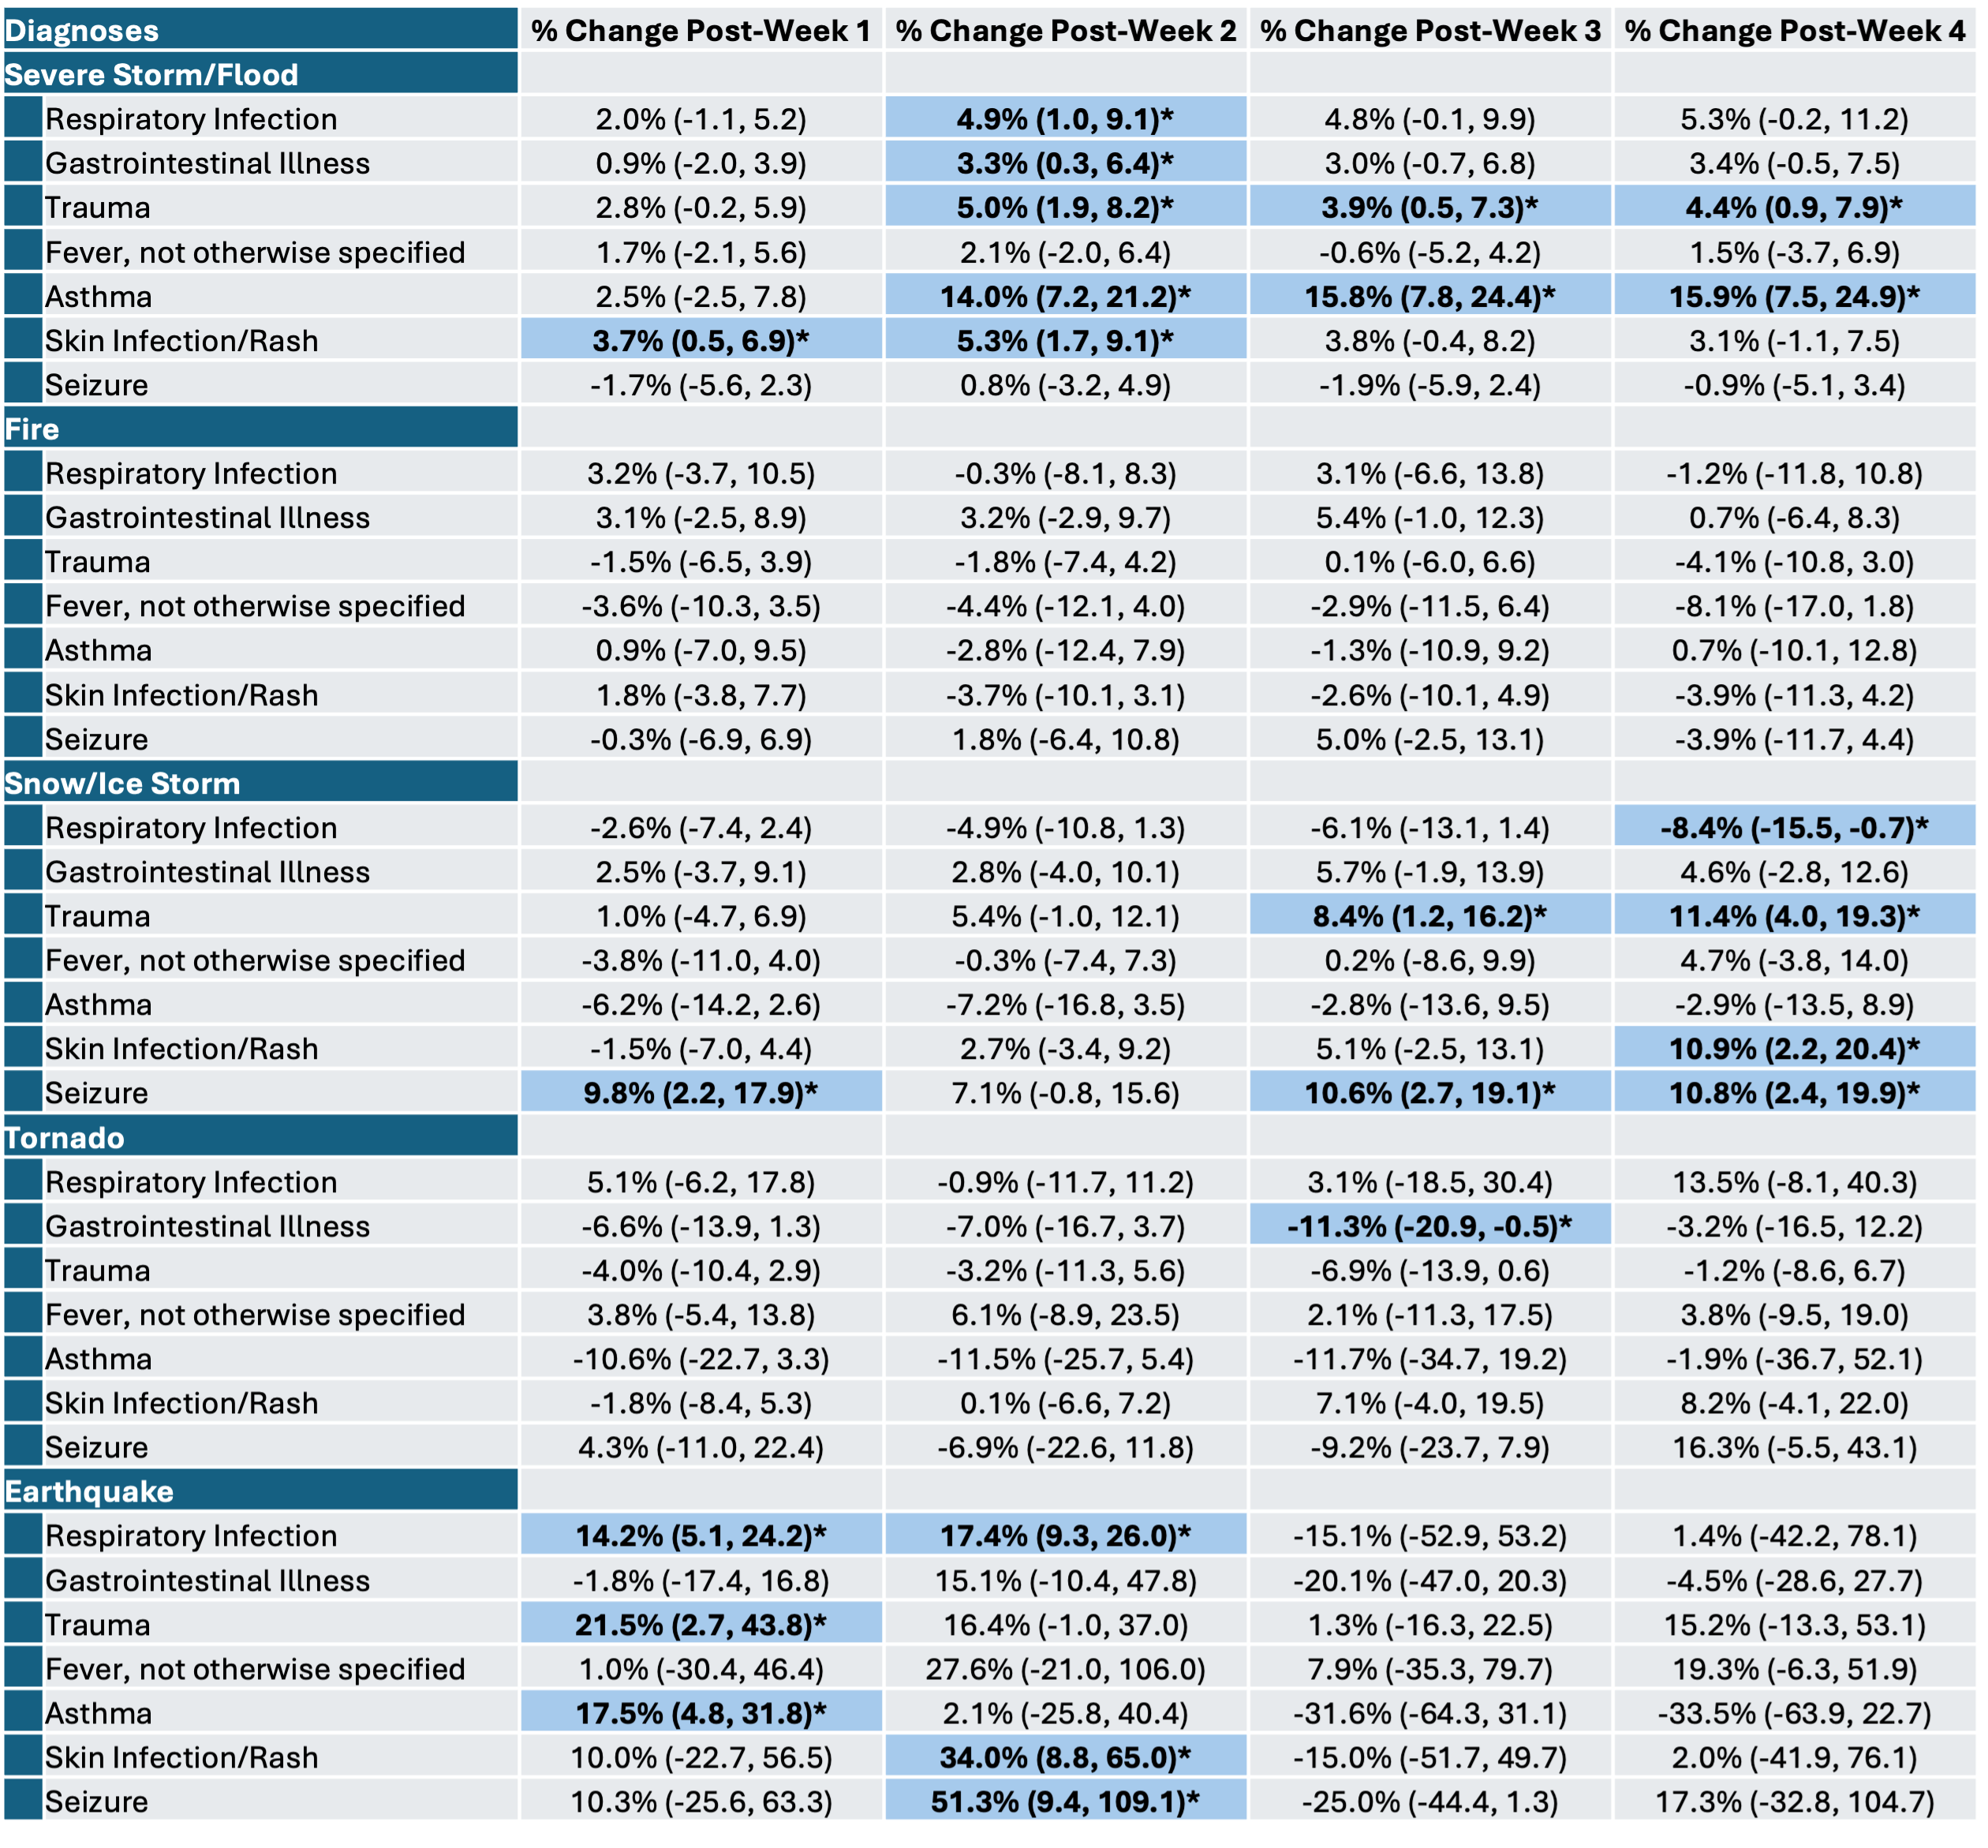 Table 1. Percent change in ED Diagnosis by hospital, with 95% confidence intervals, after (FEMA) disaster declaration by disaster type. Baseline is the number of hospital admissions the week prior to the disaster declaration. Week 1 includes day of disaster declaration. * p<0.05.