Emergency Medicine 9
Session: Emergency Medicine 9
123 - Characterizing Pediatric Emergency Department Visits to Large Pediatric Academic Centers After Local Major Disaster Declarations
Sunday, April 27, 2025
8:30am - 10:45am HST
Publication Number: 123.4289
Alexandra H. Baker, Harvard Medical School, Sharon, MA, United States; Joyce Li, Boston Children's Hospital, Boston, MA, United States; Katherine E. Douglas, Boston Children's Hospital, Boston, MA, United States; Michael Monuteaux, Boston Children's Hospital, Boston, MA, United States; Sarita Chung, Boston Children's Hospital, Boston, MA, United States

Alexandra H. Baker, MD (she/her/hers)
Assistant Professor of Pediatrics
Harvard Medical School
Boston Children's Hospital Department of Pediatrics
Sharon, Massachusetts, United States
Presenting Author(s)
Background: Annually, there are over 100 US natural and man-made disaster events that exceed state and local resources to respond. In these instances, the federal government activates a Major Disaster Declaration, which mobilizes Federal Emergency Management Agency (FEMA) assistance including public health and medical services. Comprehensive data on how disaster declarations affect pediatric emergency department (ED) volume, hospital admission, and diagnoses remains lacking.
Objective: To evaluate the impact of federal Major Disaster Declarations on pediatric emergency department volumes, hospital admissions, and ED diagnoses by disaster type, with the goal of informing preparedness and resource allocation in pediatric EDs following such events.
Design/Methods: We conducted a retrospective cohort study of patients ≤ 18 years old who presented to an ED contributing data to the Pediatric Health Information System (PHIS) which was located within 50 miles of a major disaster declaration between 2010-2023. We compared ED volumes during weeks 1–4 after the disaster declaration to baseline patient volumes from the previous week. Using Poisson regression, we calculated incidence rate ratios (percent change) with 95% CIs, stratified by FEMA disaster subtype (severe storm/flood, snow/ice storm, fire, tornado, or earthquake).
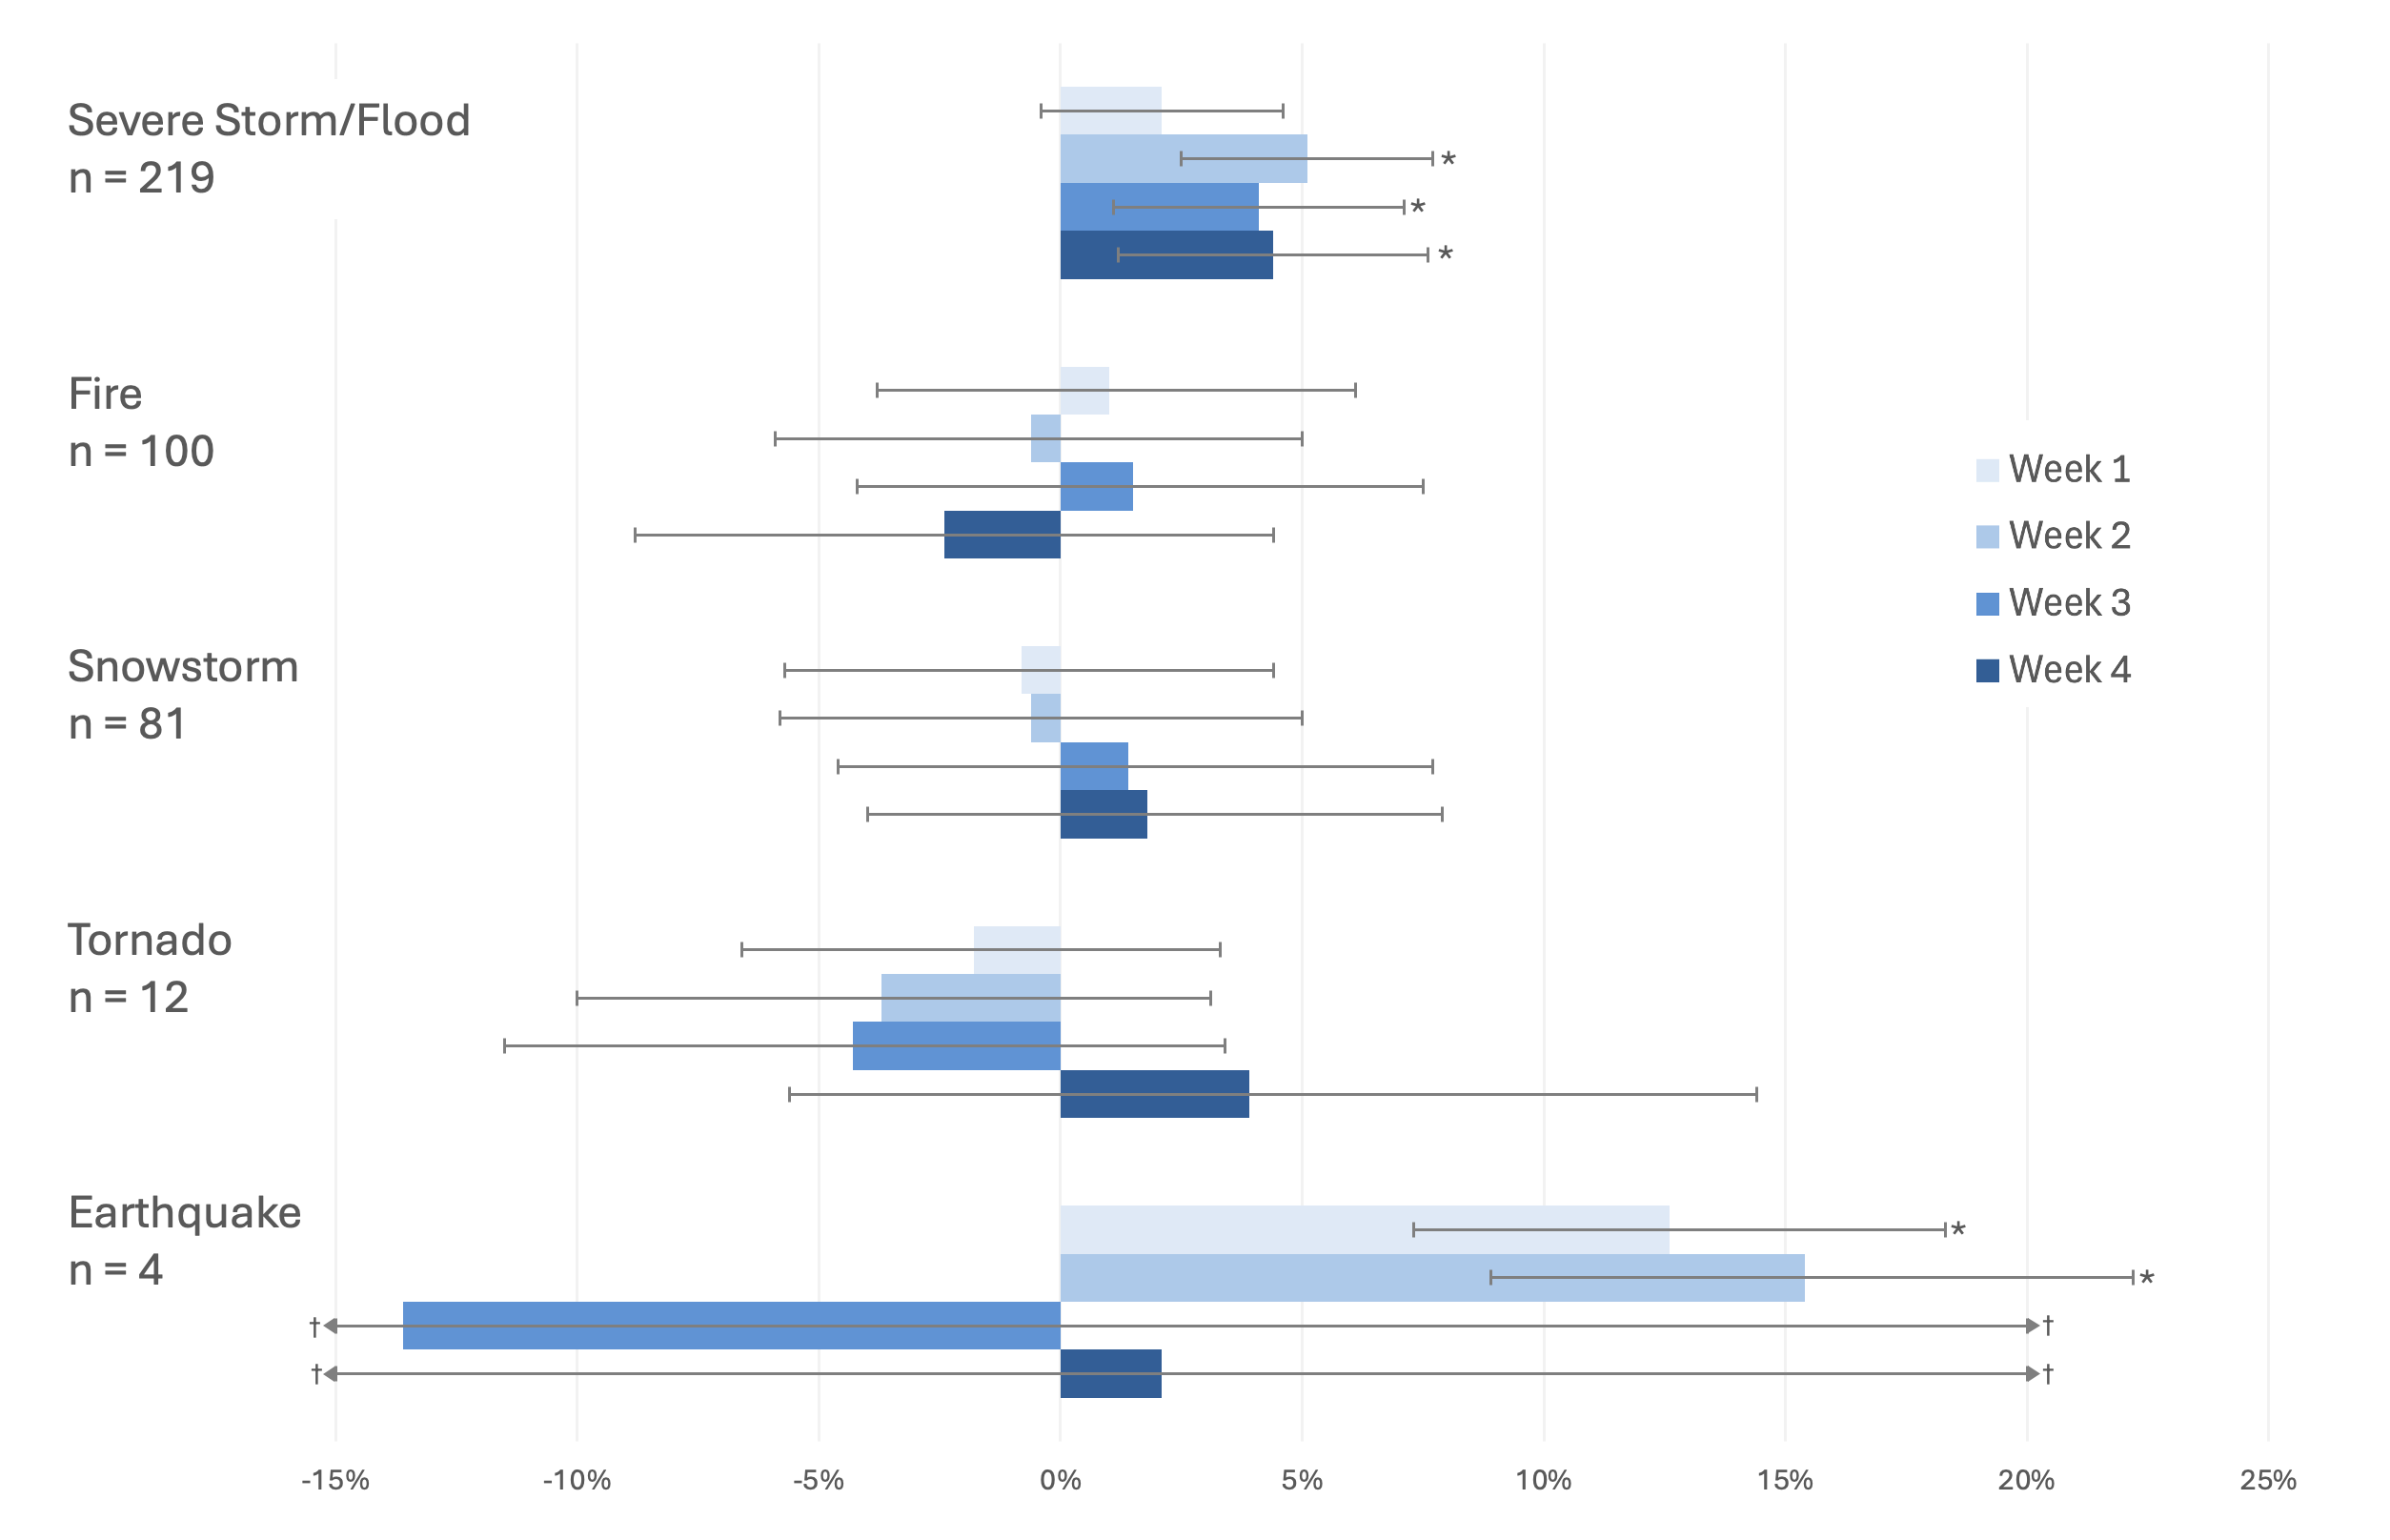
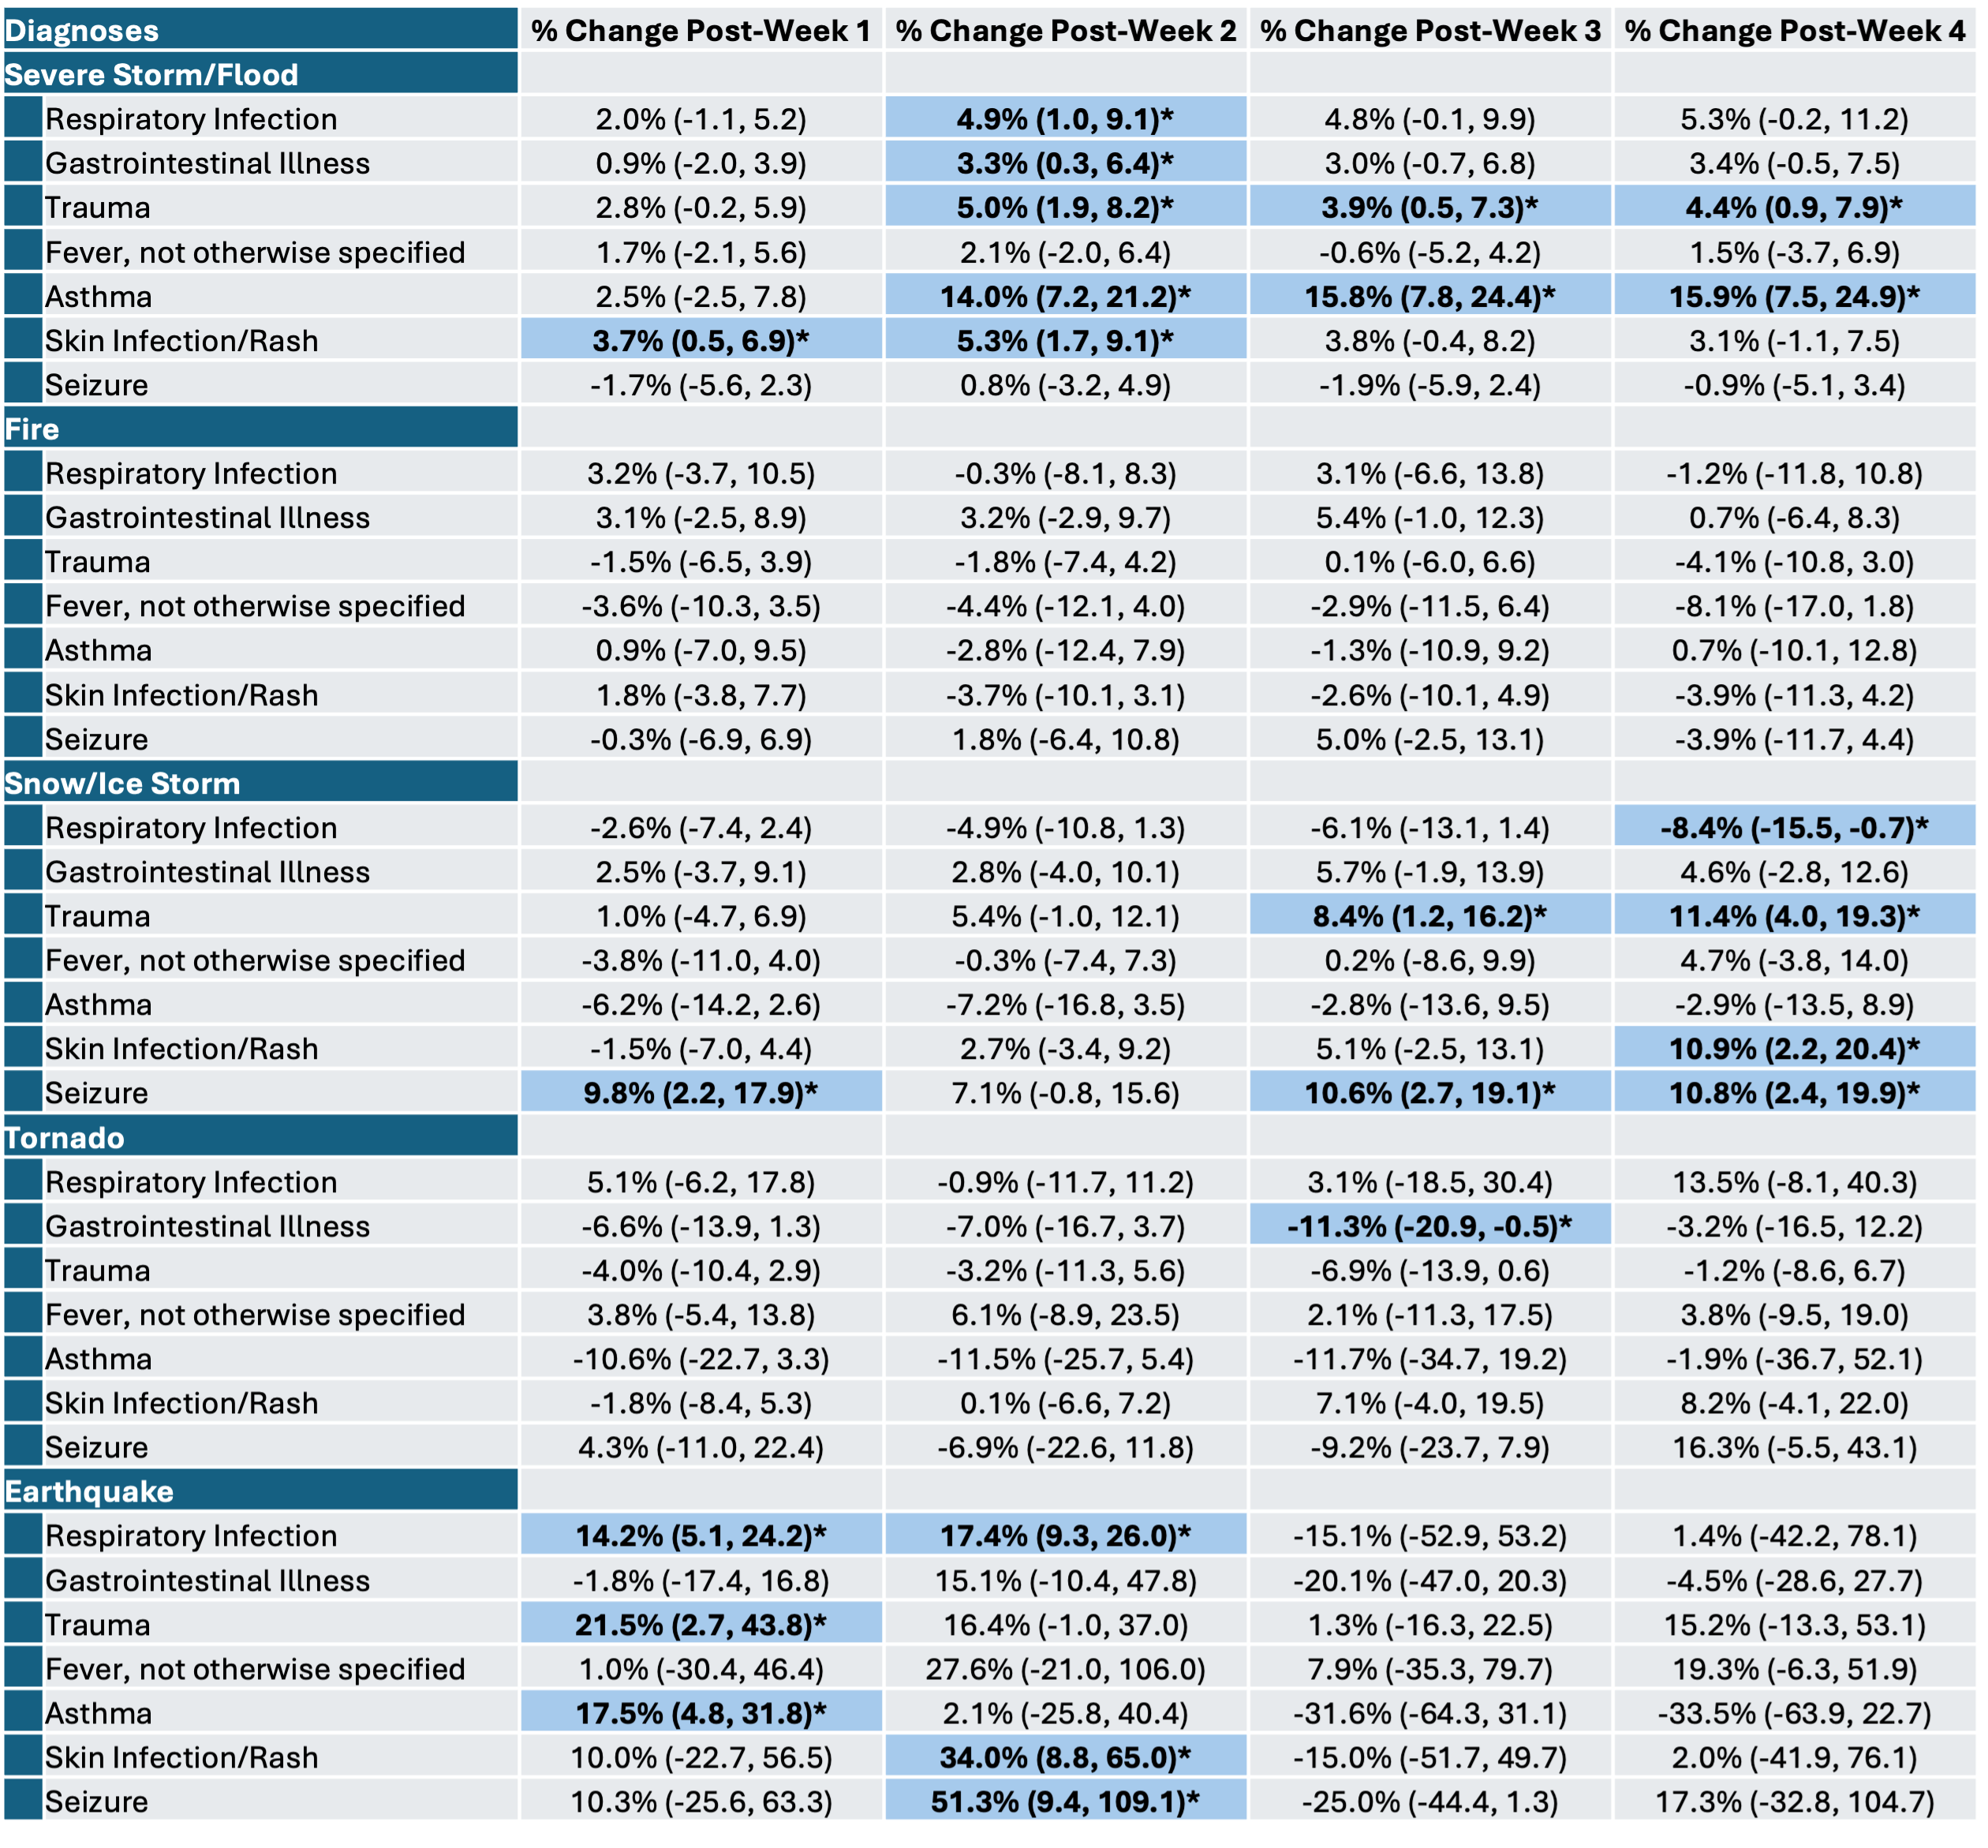
Results: During the study period, 416 FEMA declarations occurred within 50 miles of a PHIS ED. Some disaster events affected multiple hospitals. Overall, 3.1 million pediatric ED visits to one of 46 PHIS hospitals occurred between the week before to four weeks after these disaster events. ED visits increased in the weeks after severe storms/floods (weeks 2-4) and earthquakes (weeks 2-3) (Figure 1). Hospital admissions increased after severe storms/floods (weeks 2-4) but dropped after tornados (week 1) (Figure 2). Both ED visits and hospital admissions remained unchanged after snow/ice storms or a fire declaration. Changes in ED diagnoses varied by disaster type, with sustained increases in asthma exacerbations and trauma injuries after severe storms/floods and early increases in respiratory infections, trauma injuries, and asthma exacerbations after earthquakes (Table 1).
Conclusion(s): Many major disasters increase pediatric ED volumes and hospital admissions, as well as change the reasons children seek emergency care. EDs caring for children should prepare for volume surges and anticipate resource needs.
Percent change in PHIS Hospital ED patient volume after FEMA disaster declaration
 Figure 1. Percent change in ED volume by hospital, with 95% confidence intervals, after FEMA disaster declaration by disaster type. Baseline is the ED volume the week prior to the disaster declaration. Week 1 includes day of disaster declaration. n = disaster declaration/affected hospital combinations. * p<0.05. † CIs extend off graph.
 Percent change in hospital admissions after FEMA disaster declaration
.png) Figure 2. Percent change in hospital admission from the ED by hospital, with 95% confidence intervals, after (FEMA) disaster declaration by disaster type. Baseline is the number of hospital admissions the week prior to the disaster declaration. Week 1 includes day of disaster declaration. n = disaster declaration/affected hospital combinations. * p<0.05. † CIs extend off graph.
Figure 2. Percent change in hospital admission from the ED by hospital, with 95% confidence intervals, after (FEMA) disaster declaration by disaster type. Baseline is the number of hospital admissions the week prior to the disaster declaration. Week 1 includes day of disaster declaration. n = disaster declaration/affected hospital combinations. * p<0.05. † CIs extend off graph. Percent change in ED Diagnosis after FEMA disaster declaration
 Table 1. Percent change in ED Diagnosis by hospital, with 95% confidence intervals, after (FEMA) disaster declaration by disaster type. Baseline is the number of hospital admissions the week prior to the disaster declaration. Week 1 includes day of disaster declaration. * p<0.05.
