
Health Equity/Social Determinants of Health 4
Session: Health Equity/Social Determinants of Health 4
 photo")
Monique Quinn, MD (she/her/hers)
Clinical Fellow in Critical Care
Cincinnati Children's Hospital Medical Center
Cincinnati, Ohio, United States
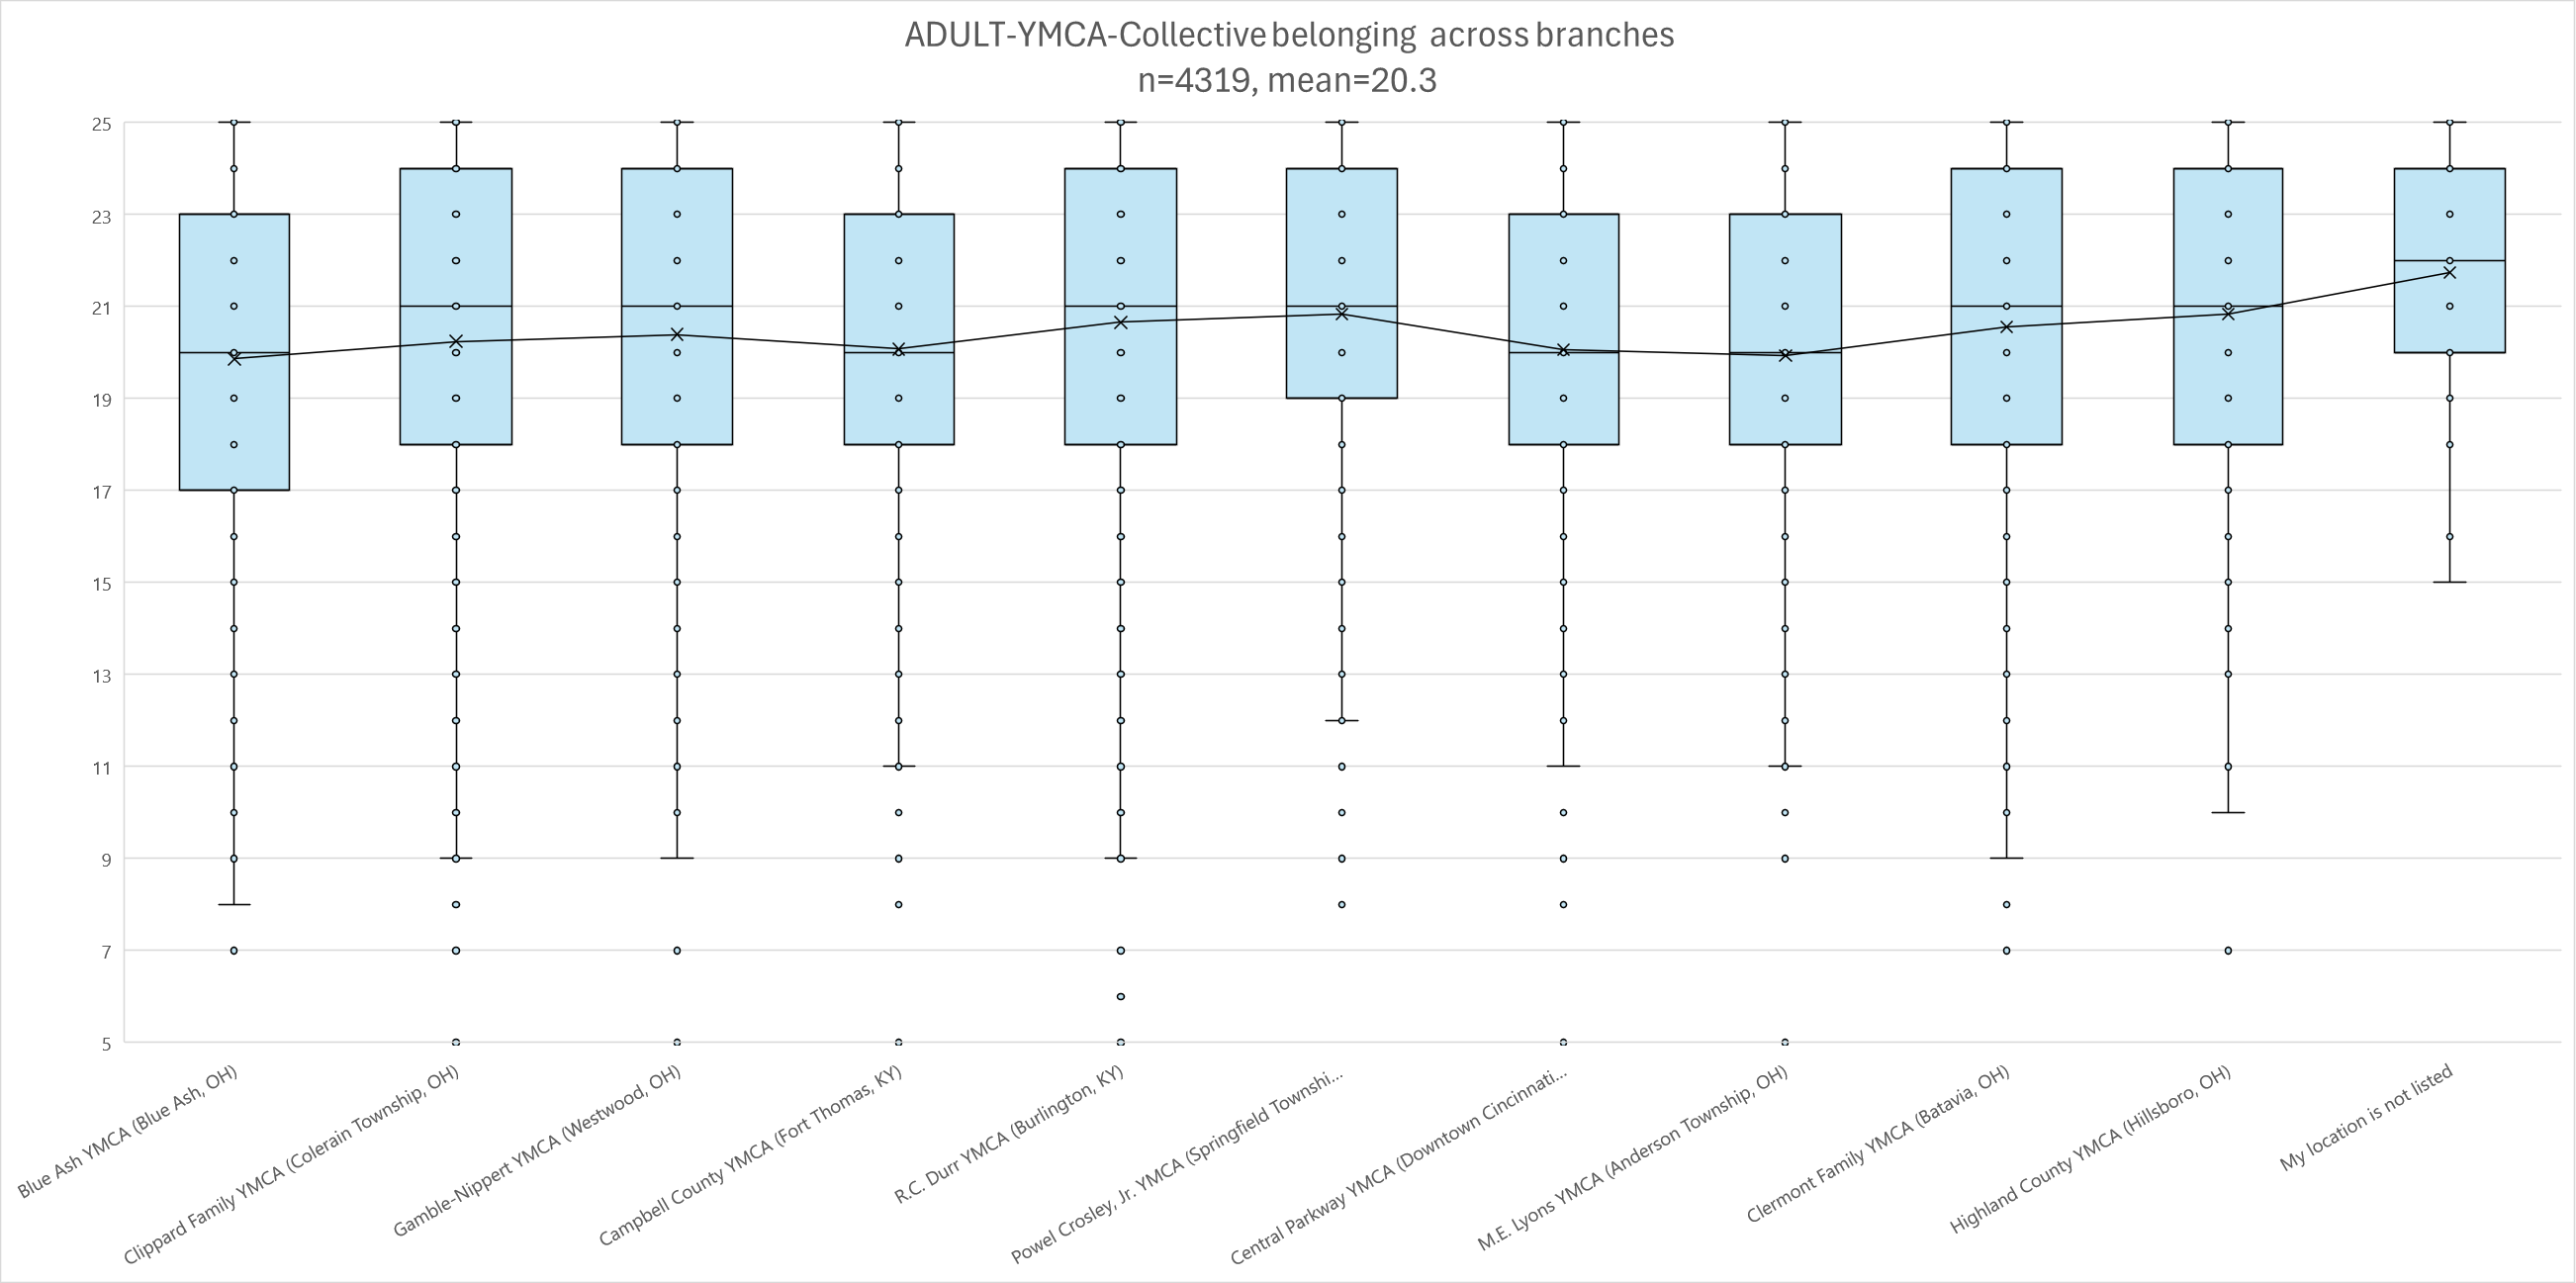 This box and whisker plot demonstrates collective belonging (sum of all five belonging questions) based on self-identified YMCA home branch. The box demonstrates the interquartile range, with the line above/below demonstrating the minimum and maximum responses. The line inside the box is the median response, with the x demonstrating the average.
 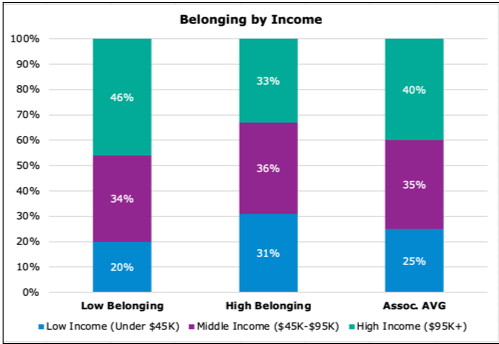 This graph depicts variations in belonging by income level. Low belonging is defined as responding to belonging questions with a score of 3. The association average bar demonstrates income breakdown across the YMCA of Greater Cincinnati for comparison.
 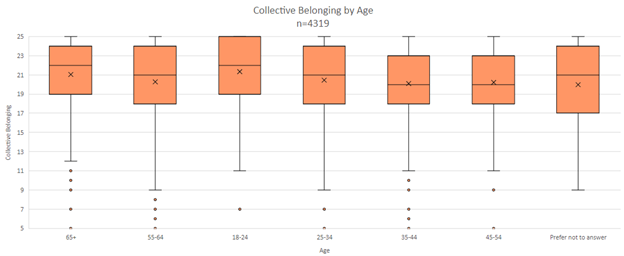 This box and whisker plot demonstrates collective belonging (sum of all five belonging questions) based on self-identified age. The box demonstrates the interquartile range, with the line above/below demonstrating the minimum and maximum responses. The line inside the box is the median response, with the x demonstrating the average.