Session: Health Equity/Social Determinants of Health 6
725 - Beyond food insecurity: a comparison of households with children who have low versus high nutrition security
Sunday, April 27, 2025
8:30am – 10:45am HST
Publication Number: 725.3747
Kieley l. Chapman, Boston Children’s Hospital, boston, MA, United States; Allison J. Wu, Boston Children's Hospital, Boston, MA, United States; Anisha U.. Gundewar, MassGeneral Hospital for Children, Boston, MA, United States; Man Luo, MassGeneral Hospital for Children, Boston, MA, United States; Meghan Perkins, MassGeneral Hospital for Children, Boston, MA, United States; Eric E.. Calloway, Center for Nutrition and Health Impact, New Braunfels, TX, United States; Daniel J. Taitelbaum, The Greater Boston Food Bank, Boston, MA, United States; Keally haushalter, University of Texas at Austin, Austin, TX, United States; Lauren Fiechtner, MassGeneral Hospital for Children, Boston, MA, United States
Fellow Boston Children’s Hospital Boston, Massachusetts, United States
Background: Household (HH) food insecurity (FI) is defined as “limited or uncertain access to sufficient, safe, and nutritious food.” Increasing attention is being paid to nutrition security, which refers to a household’s ability “to obtain foods that meet their nutritional and health needs and dietary preferences without resource limitations or worry.” However, there is limited research on the characteristics of food-insecure households by nutrition security status. Objective: This cross-sectional study aimed to examine differences in sociodemographics and dietary quality in food-insecure households with low vs. high nutrition security. Design/Methods: We used data from the 2023 Massachusetts Statewide Food Access Survey, which is an online survey of >3000 adults, led by the Greater Boston Food Bank and Mass General Brigham. To approximate a cohort eligible for the Supplemental Nutrition Assistance Program (SNAP), respondents who reported a HH with ≥1 child, HH FI within the past year, and annual income <$50,000 were included (n=335). Nutrition security was measured using the 4-item Nutrition Security Scale; low nutrition security was defined as a score of ≤2. Child and adult diet quality were assessed using the Prime Quality Diet Score (PDQS) (n=317). Food insecurity was measured using the USDA 18-item Household Food Security Survey Module. To compare group differences, Pearson’s Chi-squared test and Welch Two Sample t-tests were used. Associations of SNAP use and food pantry use with nutrition security were assessed using unadjusted and adjusted logistic regression models. Results: HH with low (vs. high) nutrition security have greater prevalence of child-level food insecurity, SNAP use, and food pantry use (Table 1). There were no differences by HH size, number of children, race/ethnicity, or income between low vs. high nutrition secure HH. HH using SNAP (OR 2.8, 95%CI 1.78 to 4.41) and food pantries (OR 2.3, 95%CI 1.4 to 3.77) had higher adjusted odds of low nutrition security (Table 2). In addition, HHs with low nutrition security reported lower total PDQS for adults (43 ± 5.1) compared to those with high nutrition security (44 ± 4.3, p=0.023) (Table 3).
Conclusion(s): SNAP and food pantry use are associated with lower nutrition security among HH with FI. Our cross-sectional study is not able to disentangle if there is reverse causality; low nutrition secure HH may need more support and thus use food assistance programs. Focus on the provision of nutritious foods through food assistance programs, and potentially layering multiple food assistance programs for HH with FI, warrants further consideration.
Table 1. Differences in sociodemographic characteristics and food assistance utilization by nutrition security status Comparison of differences in sociodemographic characteristics and food assistance utilization by low versus high nutrition security status assessed by Chi-square (categorical variables) and t-test (continuous variables) (n=335).
Table 2: Associations of SNAP use and food pantry use with nutrition security status 
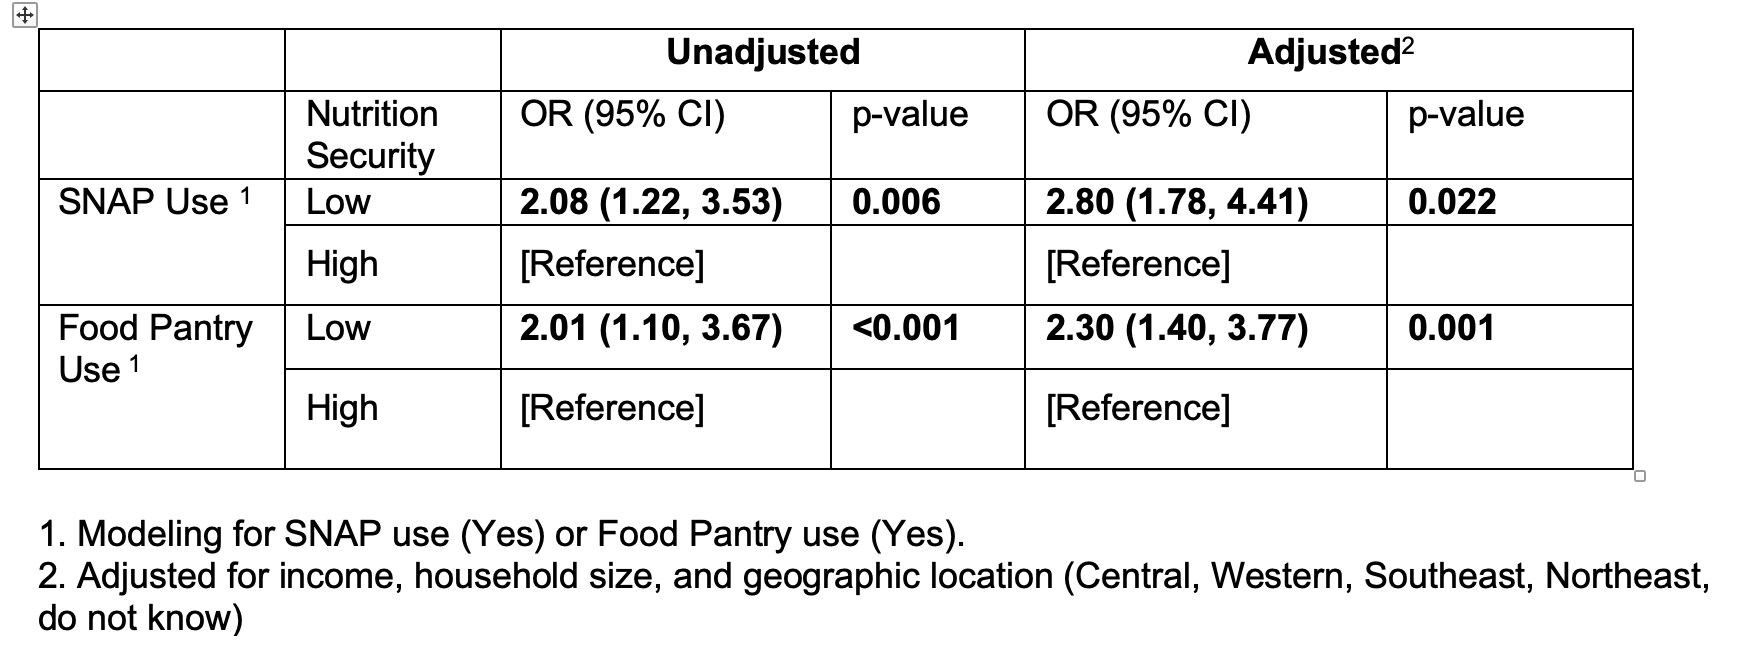
Unadjusted and adjusted logistic regression models to examine associations of SNAP use and food pantry use with nutrition security status (n=335).
Table 3. Differences in Prime Quality Diet Score (PDQS) by nutrition security status 
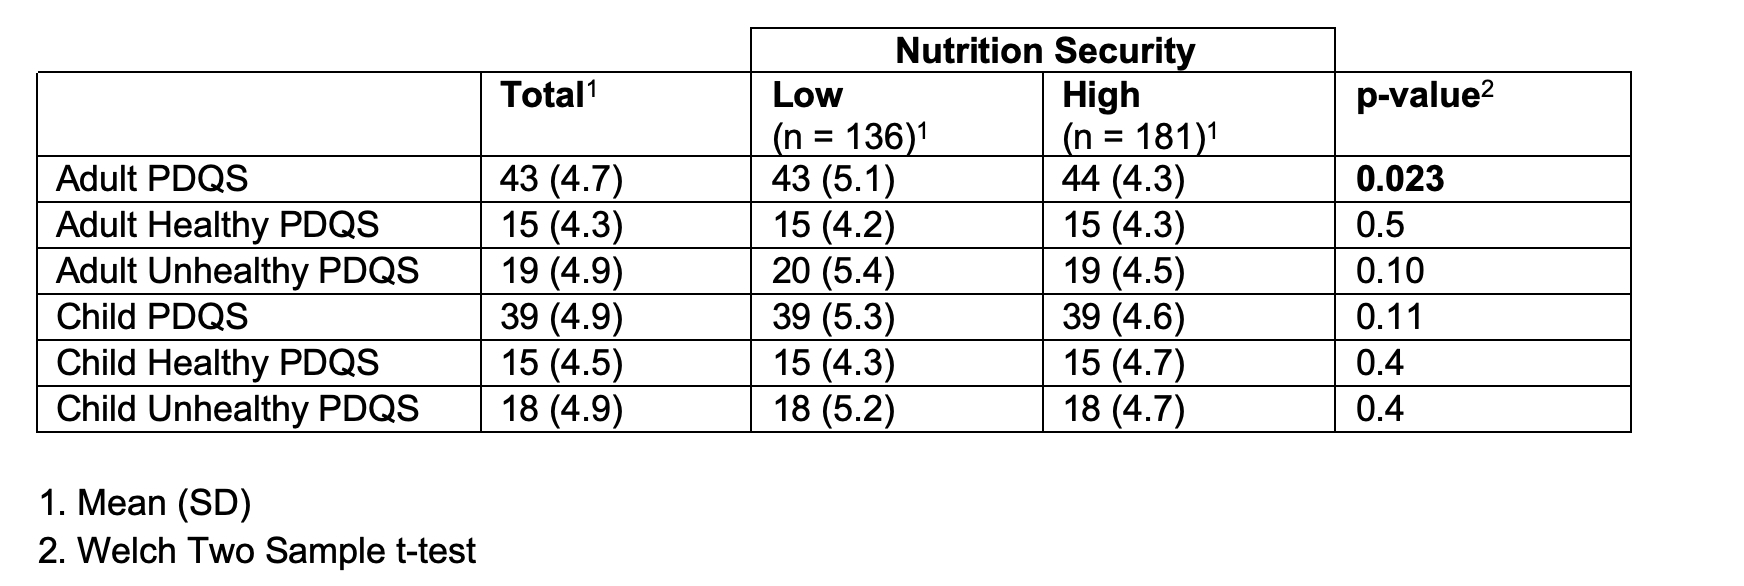
Comparison of differences in adult and child PDQS by low versus high nutrition security status assessed by Welch two sample t-tests (n=317).