
Gastroenterology/Hepatology
Session: Gastroenterology/Hepatology
 photo")
Candice Song, DO (she/her/hers)
Pediatric Resident
Eastern Virginia Medical School at Macon and Joan Brock Virginia Health Sciences
Chesapeake, Virginia, United States
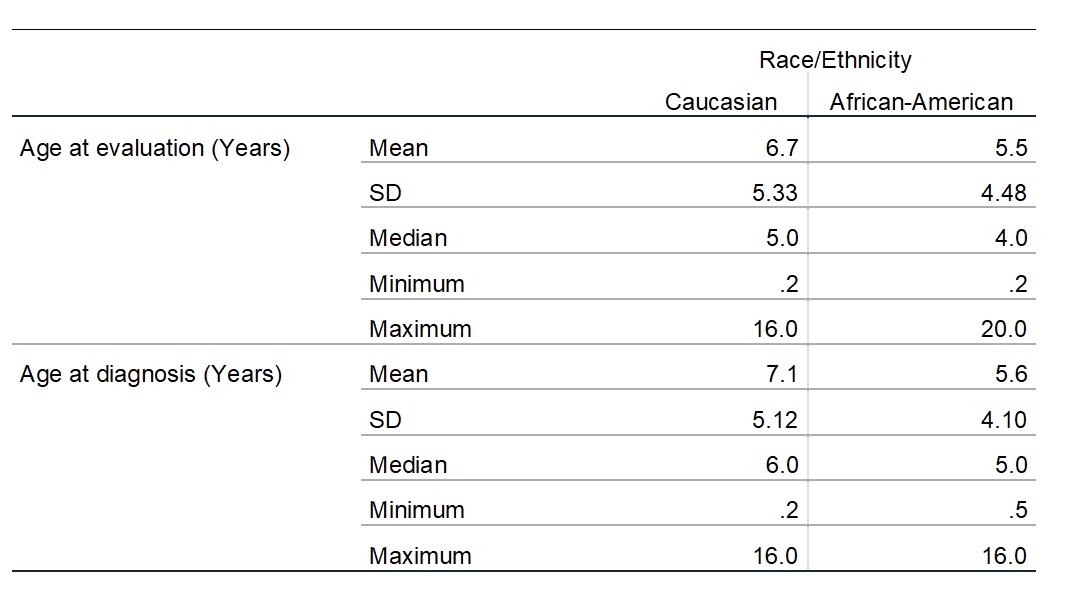 This table compares the age at presentation and age at diagnosis in years between African-American and Caucasian patients. It compares the mean, standard deviation (SD), median, minimum, and maximum age in years. The table shows no significant difference between the two groups in age at evaluation (p=0.45) and age at diagnosis (p=0.40).
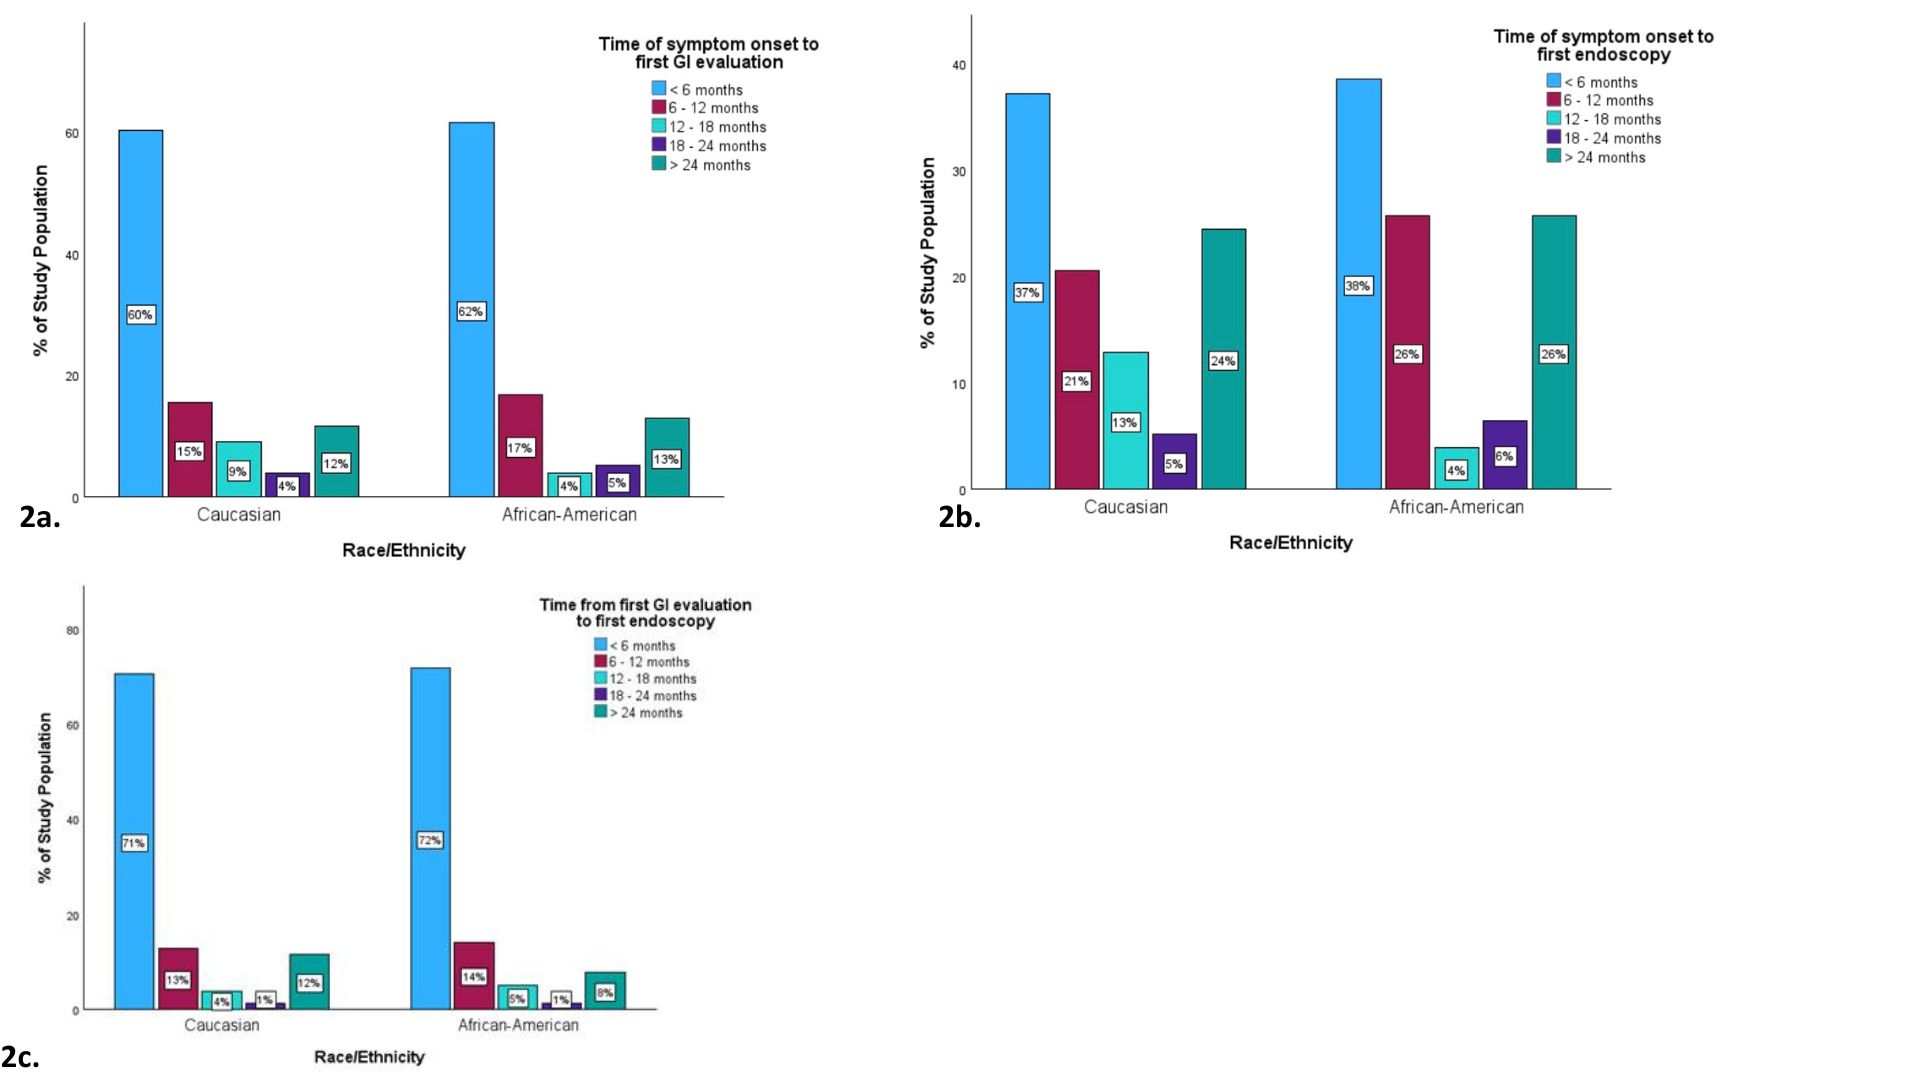 These graphs compare the length of a. time of symptom onset to GI appointment, b. time of symptom onset to first endoscopy, and c. time from initial GI evaluation to first endoscopy between African-Americans and Caucasians. The graphic data shows there was no significant difference between the two groups (p=0.66, p=0.47, p=0.48 respectively).This table compares the age at presentation and age at diagnosis in years between African-American and Caucasian patients. It compares the mean, standard deviation (SD), median, minimum, and maximum age in years. The table shows no significant difference between the two groups in age at evaluation (p=0.45) and age at diagnosis (p=0.40).These graphs compare the length of a. time of symptom onset to GI appointment, b. time of symptom onset to first endoscopy, and c. time from initial GI evaluation to first endoscopy between African-Americans and Caucasians. The graphic data shows there was no significant difference between the two groups (p=0.66, p=0.47, p=0.48 respectively).