
Emergency Medicine 8
Session: Emergency Medicine 8
 photo")
Max Ledersnaider, MD (he/him/his)
Resident
Ann & Robert H. Lurie Children's Hospital of Chicago
Chicago, Illinois, United States
.png) Sample Demographics
Sample Demographics.png) Sensitivity, specificity, and positive likelihood ratio of minimum O2 saturation with study outcomes. Abbreviations: Sens (Sensitivity), Spec (Specificity), PLR (positive likelihood ratio), CI (Confidence Interval).
Sensitivity, specificity, and positive likelihood ratio of minimum O2 saturation with study outcomes. Abbreviations: Sens (Sensitivity), Spec (Specificity), PLR (positive likelihood ratio), CI (Confidence Interval). 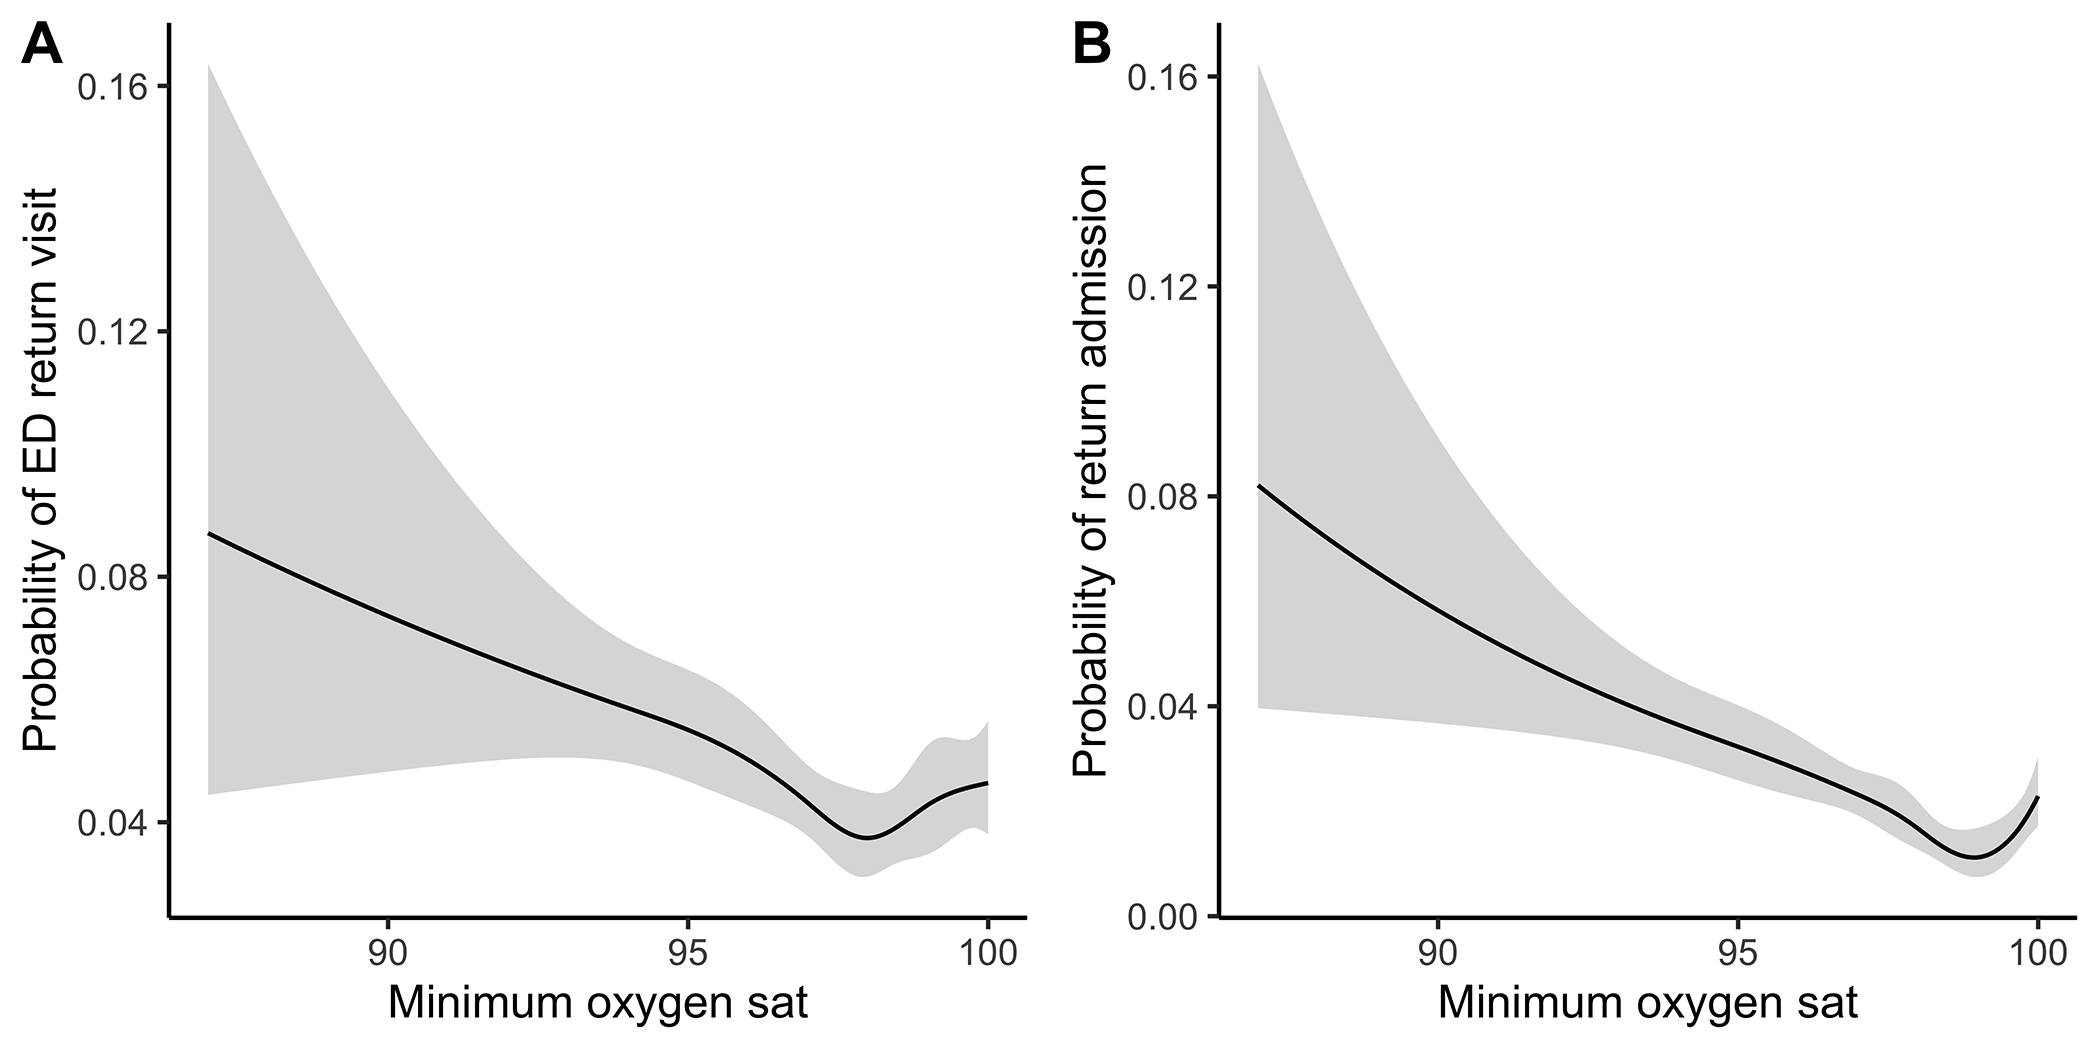 Association of minimum oxygen saturation with study outcomes in splined regression models.Sample DemographicsSensitivity, specificity, and positive likelihood ratio of minimum O2 saturation with study outcomes. Abbreviations: Sens (Sensitivity), Spec (Specificity), PLR (positive likelihood ratio), CI (Confidence Interval). Association of minimum oxygen saturation with study outcomes in splined regression models.