724 - Fecal Vitamin E is Lower in Infants with Pathologic Feeding Intolerance
Saturday, April 26, 2025
2:30pm – 4:45pm HST
Publication Number: 724.4887
Eric B. Ortigoza, UT Southwestern Medical Center, Dallas, TX, United States; Lindsay Roblyer, University of Texas Southwestern Medical School, Dallas, TX, United States; Xinying niU, UT southwestern medical center, Grapevine, TX, United States; Dongmei Lu, University of Texas Southwestern Medical School, Dallas, TX, United States; Xiaowei Zhan, University of Texas Southwestern Medical School, Dallas, TX, United States; Andrew Y.. Koh, University of Texas Southwestern Medical School, Dallas, TX, United States; Julie Mirpuri, University of Texas Southwestern Medical School, Irving, TX, United States
Associate Professor of Pediatrics UT Southwestern Medical Center Dallas, Texas, United States
Background: Enteral feeding is challenging in preterm infants because of feeding intolerance. Developmental feeding intolerance (DFI) results from gastrointestinal (GI) immaturity and dysmotility, whereas pathologic feeding intolerance (PFI) is associated with ileus due to sepsis, necrotizing enterocolitis (NEC), spontaneous intestinal perforation (SIP), and bowel obstruction. Non-specific clinical signs of DFI are often misinterpreted as PFI, leading to feeding cessation or limitation. We must develop specific, objective biomarkers to differentiate DFI from PFI. Objective: To compare differences in gut microbiota-derived metabolites between infants with DFI, PFI, and no feeding intolerance (NFI). Design/Methods: This is a longitudinal cohort study of infants < 34 and ≥37 weeks’ gestation who underwent weekly stool collection. Infants were classified into 3 groups based on objective criteria. NFI was defined as having both criteria of sustained feeding tolerance: 1) achieved full feeds (≥120 mL/Kg/day) sustained for ≥5 days without parenteral nutrition and 2) growth velocity ≥10g/Kg/day from the 1st day of full feeds until 34w6d postmenstrual age. DFI was defined as having ≤1 of the aforementioned criteria and no GI pathology while PFI was defined as having GI pathology (septic ileus, NEC Stage ≥IIa, SIP, or bowel obstruction). High resolution untargeted metabolomics was performed using mass spectrometry on stool samples. Median and variance differential analysis were performed for each group comparison (NFI vs. DFI, NFI vs. PFI, and DFI vs. PFI) and displayed as a volcano plot. Independent t-tests were conducted for each annotated ion and FDR-corrected using the Benjamini-Hochberg procedure. Principal component analysis and pathway analysis are being conducted. Results: 94 infants (82 NFI, 6 DFI, 6 PFI) were included (Table 1). 580 stool samples were analyzed. Metabolites were compared between groups with the following significant findings: The NFI group demonstrated higher alpha-tocopherol (p < 0.001) and gamma-tocopherol (p < 0.001) compared to PFI. The DFI group also demonstrated higher alpha-tocopherol (p=0.011) compared to PFI. See Figure 1 for all group comparisons. Table 2 lists metabolites that were differentially abundant between groups.
Conclusion(s): Fecal alpha-tocopherol (Vitamin E) was higher in both NFI and DFI groups, compared to PFI. Vitamin E is an antioxidant and immunomodulator with anti-inflammatory properties that may play a role in modulating inflammatory response. The utility of Vitamin E in differentiating DFI from PFI and clinical significance of other metabolites requires further investigation.
Table 1. Demographics
Figure 1. Differential Analysis Between Groups 
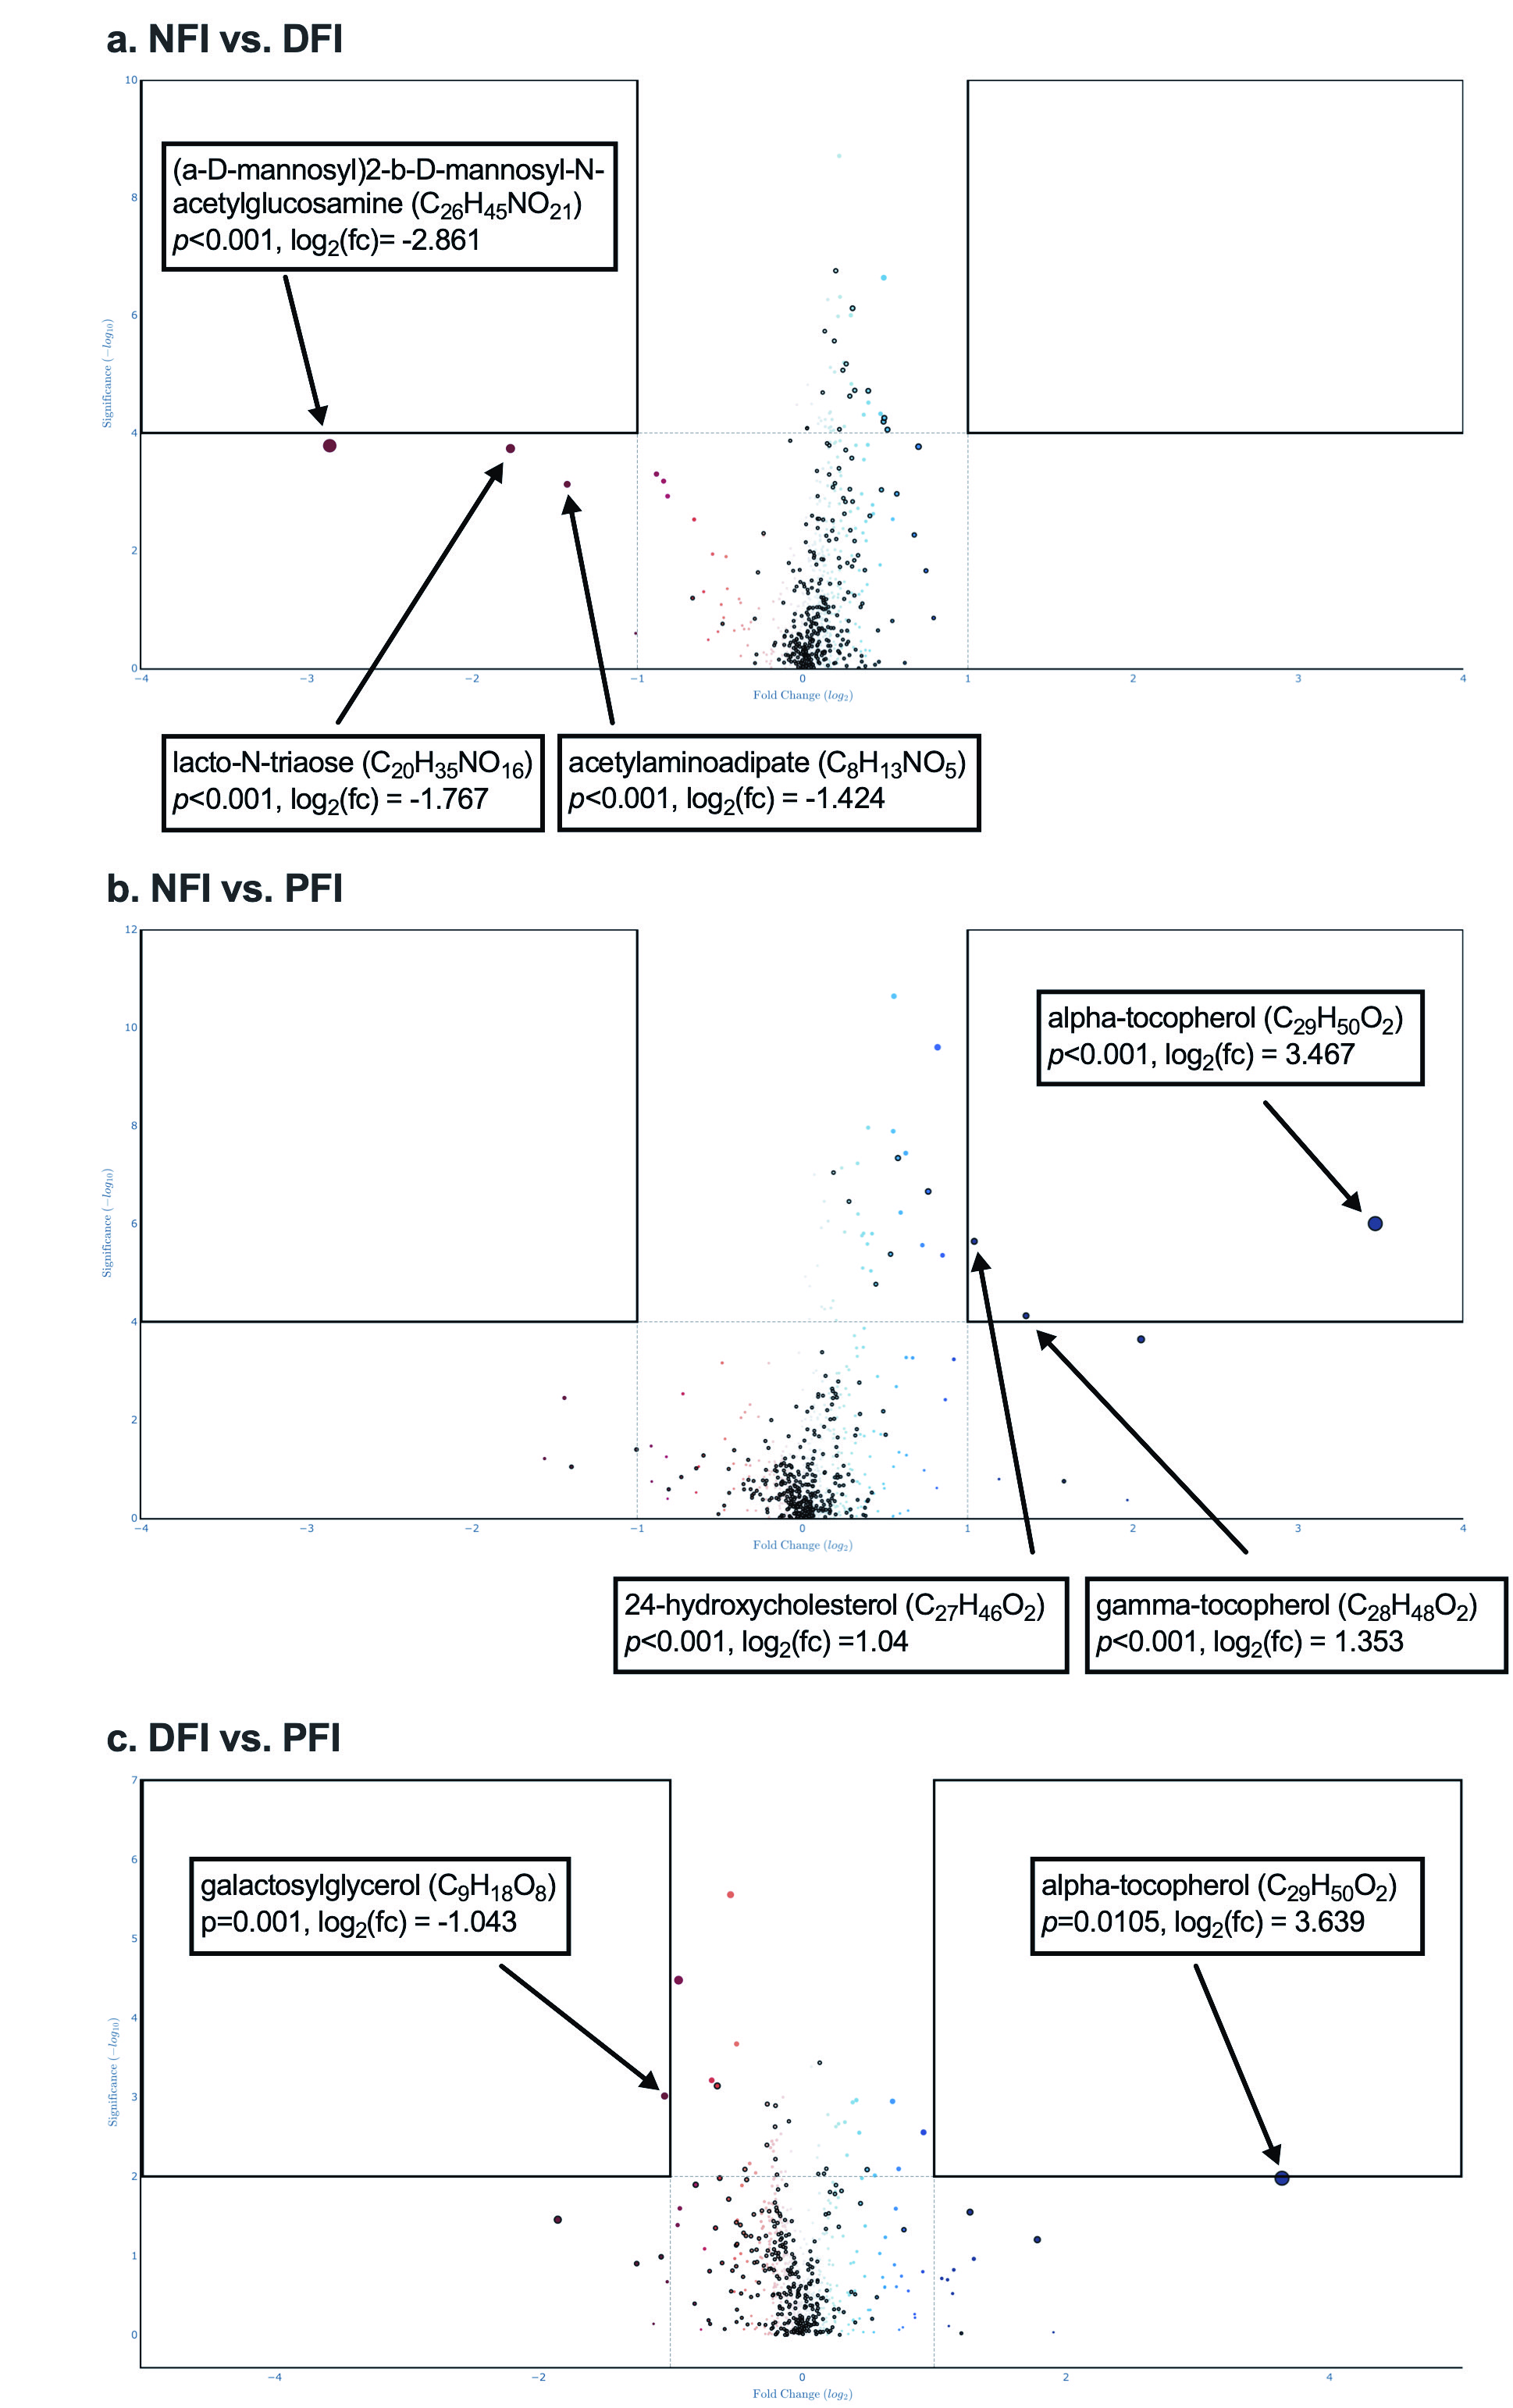
Median and variance differential analysis are shown as volcano plots: a) The NFI group demonstrated lower (a-D-mannosyl)2-b-D-mannosyl-N-acetylglucosamine (p < 0.001), acetylaminoadipate (p < 0.001), and lacto-N-triaose (p < 0.001) when compared to the DFI group. b) The NFI group demonstrated higher alpha-tocopherol (p < 0.001), gamma-tocopherol (p < 0.001), and 24-hydroxycholesterol (p < 0.001) when compared to the PFI group. c) The DFI group demonstrated higher alpha-tocopherol (p=0.0105) and lower galactosylglycerol (p=0.001) compared to the PFI group.
Table 2. Microbiota-Derived Metabolites (Untargeted Metabolomic Profiling). 
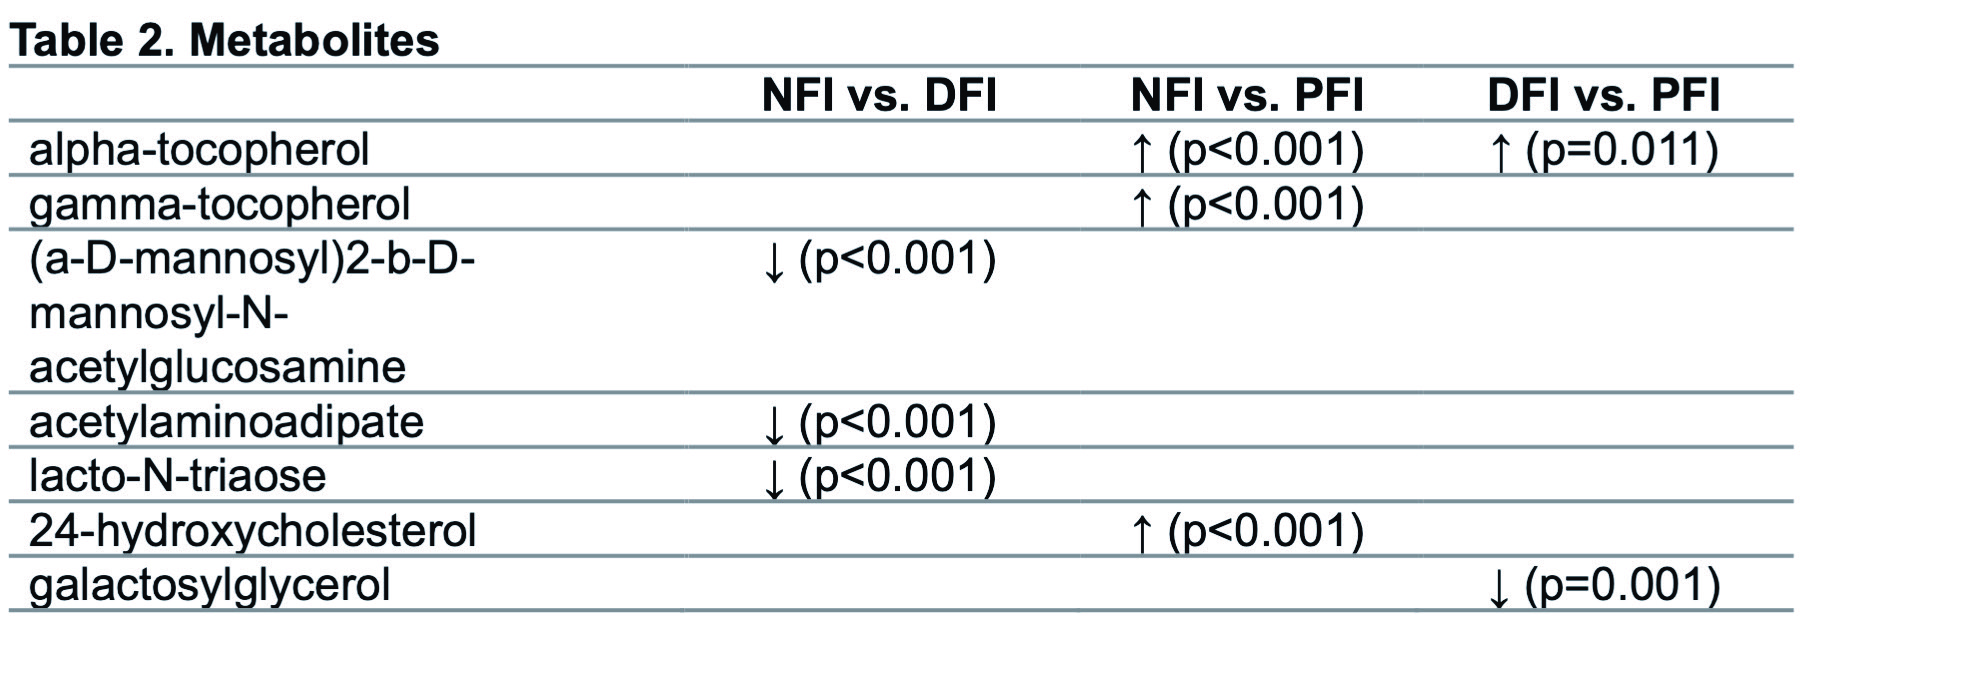
Comparisons between groups.