Breastfeeding/Human Milk 3
Session: Breastfeeding/Human Milk 3
673 - Associations of Human Milk Metabolomic Profiles with Growth and Neurodevelopmental Outcomes at 6 and 12 Months of Life
Saturday, April 26, 2025
2:30pm - 4:45pm HST
Publication Number: 673.3769
Margaret L.. Ong, Brigham and Women's Hospital, Boston, MA, United States; Carmen Monthe-Dreze, Brigham and Women's Hospital, Boston, MA, United States; Chloe Andrews, Women & Infants Hospital of Rhode Island, Providence, RI, United States; Patricia A. Sheridan, Metabolon, Chapel Hill, NC, United States; Wei Perng, Colorado School of Public Health, Aurora, CO, United States; Sara Cherkerzian, Harvard Medical School, Boston, MA, United States; Camilia R. Martin, Weill Cornell Medicine, New York, NY, United States; Sarbattama Sen, Women & Infants Hospital of Rhode Island, providence, RI, United States

Margaret L. Ong, MD, MPH (she/her/hers)
Neonatologist
Brigham and Women's Hospital
Boston, Massachusetts, United States
Presenting Author(s)
Background: Exposure to maternal obesity increases risk of obesity and adverse neurodevelopmental outcomes (NDO) in children. Human milk (HM) feeding is associated with growth and developmental benefits, but there is a gap in our understanding of how specific HM components impact outcomes among children of women with obesity.
Objective: To investigate associations between HM metabolomic profiles and growth and NDO in infants of women with obesity
Design/Methods: This secondary analysis of a randomized controlled trial (NCT02802566) includes a sub-cohort of 26 infants born to women with obesity. A full breast expression from a first morning feed was self-collected at 5.5±2.0 weeks postpartum. HM metabolites were analyzed via untargeted ultra-performance liquid chromatography with tandem mass spectrometry. We used principal component analysis to consolidate 669 HM metabolites into factors and used eigenvalues >1 and scree plots to determine the number of retained factors. We fit linear regression models to quantify associations between retained factor scores and 1) weight, 2) length, 3) weight-for-length (WFL), and 4) head circumference (HC) z-scores per WHO standard, and 5) Ages and Stages Questionnaire (ASQ) scores at 6 and 12 months (mo) of age, adjusting for trial study group and maternal body mass index (mBMI). We performed Metabolite Set Enrichment Analysis (MetaboAnalyst) to identify pathways of interest.
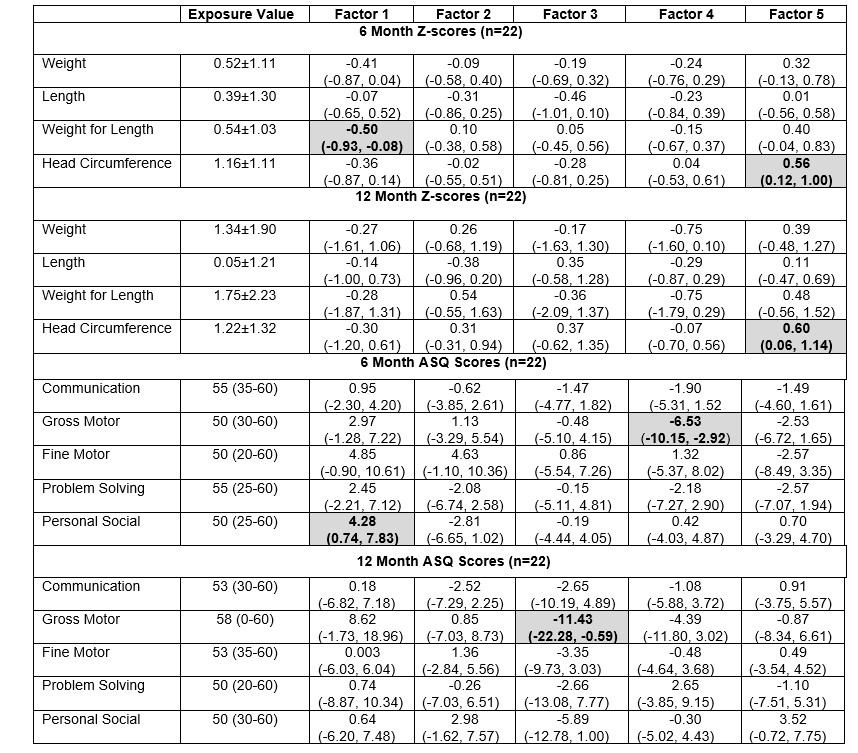
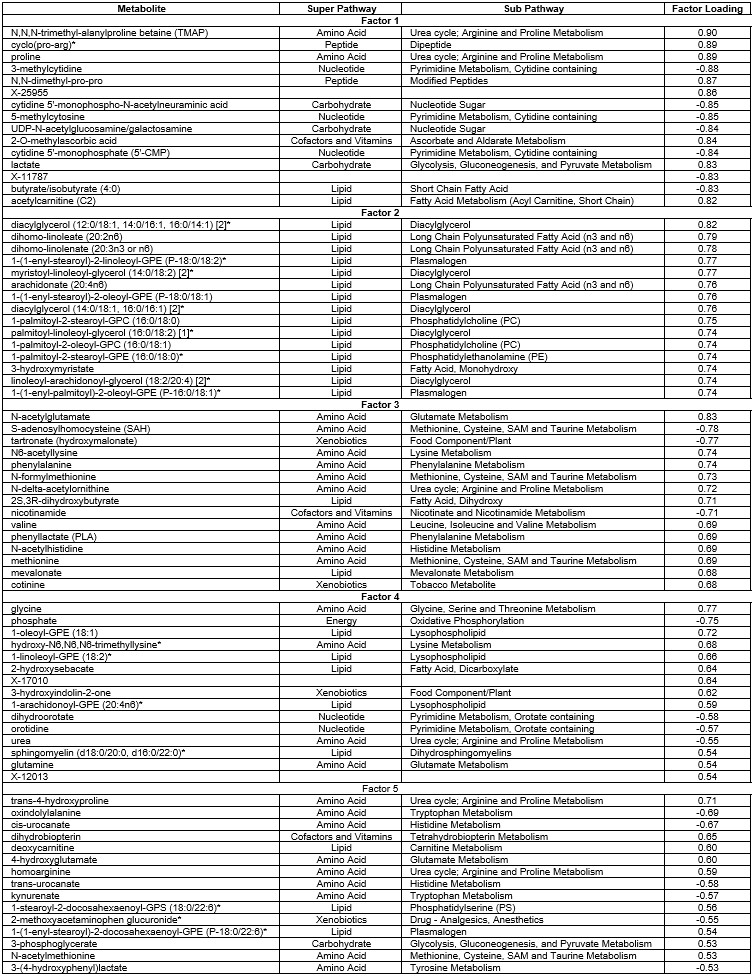
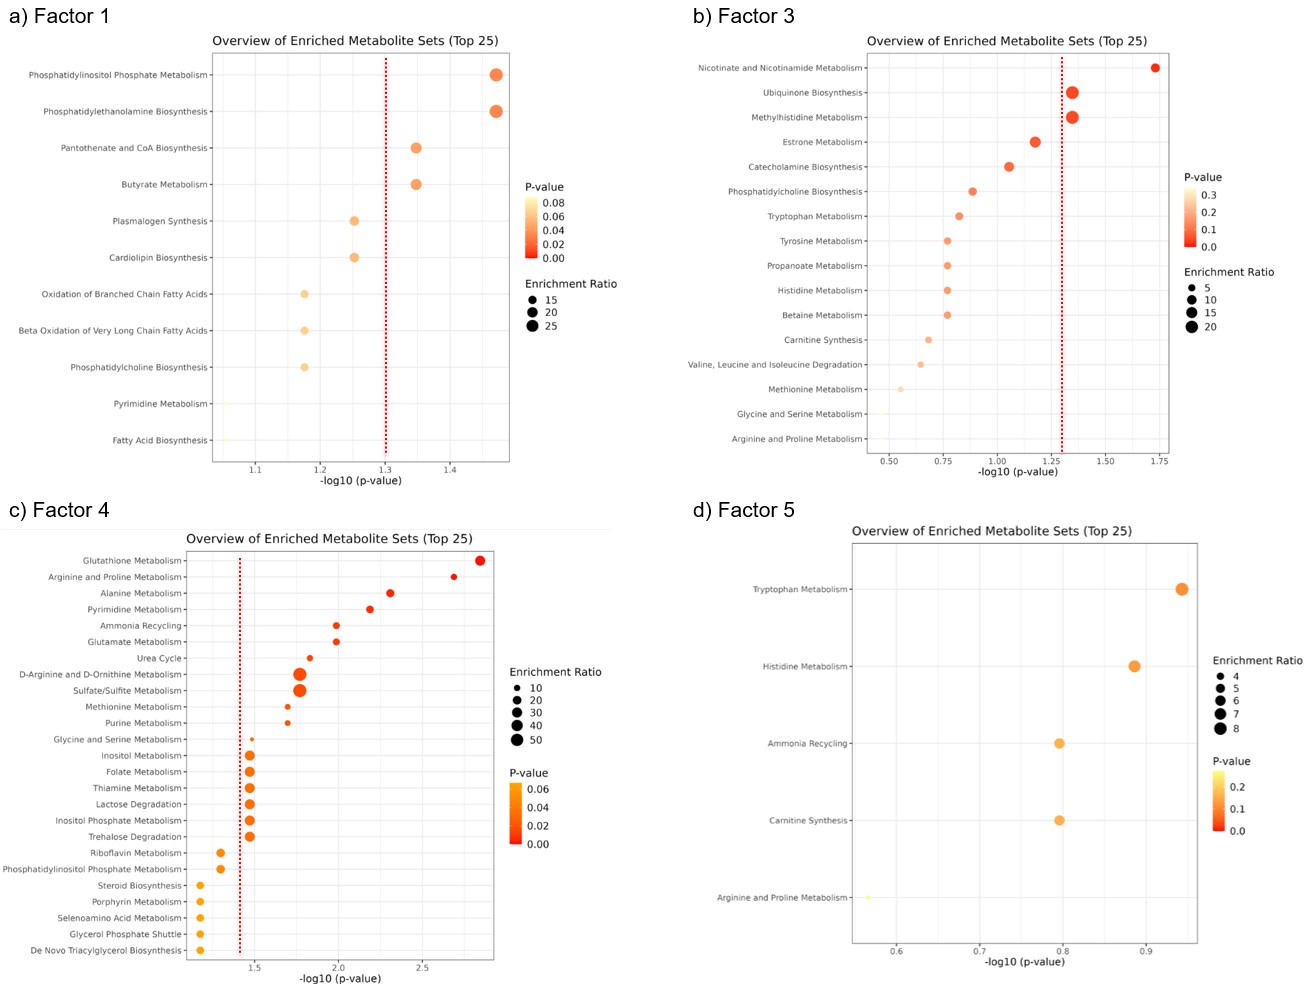
Results: Mean±SD for mBMI, maternal age, and gestational age were 35.7±4.4 kg/m2, 32.8±5.1 years, and 38.6±2.0 weeks, respectively. We noted suspected developmental delay in ≥ 1 ASQ domains for 18% (6 mo) and 23% (12 mo) of the cohort. Mean WFL z-scores were 0.54±1.03 (6 mo) and 1.75±2.23 (12 mo) [Table 1]. We retained the first five factors that explained 54% of the data variance. Higher Factor 1 scores, enriched in metabolites participating in phospholipid metabolism [Table 2, Figure 1], were associated with lower WFL z-scores and higher personal-social scores at 6 mo. Higher Factor 5 scores, enriched in metabolites involved in tryptophan metabolism, were associated with larger HC z-scores. Higher scores for Factor 3 and Factor 4–both enriched in metabolites involved in oxidative stress pathways (Factor 3: nicotinamide and ubiquinone, Factor 4: glutathione) were associated with lower gross motor scores.
Conclusion(s): In infants of women with obesity, specific patterns of HM phospholipid, protein synthesis, and oxidative stress metabolites were protective against obesity and adverse NDO. These findings lay the foundation for larger studies to inform interventions to improve outcomes in this high-risk population.
Table 1. Linear Regression Results for Adjusted Associations between Human Milk Metabolite Factor Scores and Anthropometric and Neurodevelopmental Outcomes at 6 and 12 Months of Age
 Exposure values are represented as mean±SD for anthropometric z-scores and median (range) for Ages and Stages Questionnaire (ASQ) total scores. Z-scores at 6 and 12 months of age were calculated using actual age for term infants and corrected age for preterm infants utilizing the WHO standard. Linear regression model results are reported as beta estimates (95% CI) indicating change in outcome for each 1 unit increase in metabolomic factor score, adjusting for original study treatment group and maternal BMI. Shaded boxes represent findings for which p<0.05.
 Table 2. Metabolite Composition (Top 15) of Five Retained Factors

Figure 1. Enriched Metabolite Sets from Factors Associated with Child Outcomes
 Enrichment ratio: # hits / # expected hits for specific metabolic pathways. Out of the top 15 metabolites a) 9/15 for Factor 1, b) 15/15 for Factor 3, c) 8/15 for Factor 4, and d) 9/15 for Factor 5 were identifiable in MetaboAnalyst 6.0 (https://www.metaboanalyst.ca/) and utilized for Metabolite Set Enrichment Analysis / Over-Representation Analysis. Pathway enrichment with -log10 (P-value) > 1.3 (P-value < 0.05) is considered statistically significant (indicated by dashed red lines).
