
Breastfeeding/Human Milk 3
Session: Breastfeeding/Human Milk 3
 photo")
Margaret L. Ong, MD, MPH (she/her/hers)
Neonatologist
Brigham and Women's Hospital
Boston, Massachusetts, United States
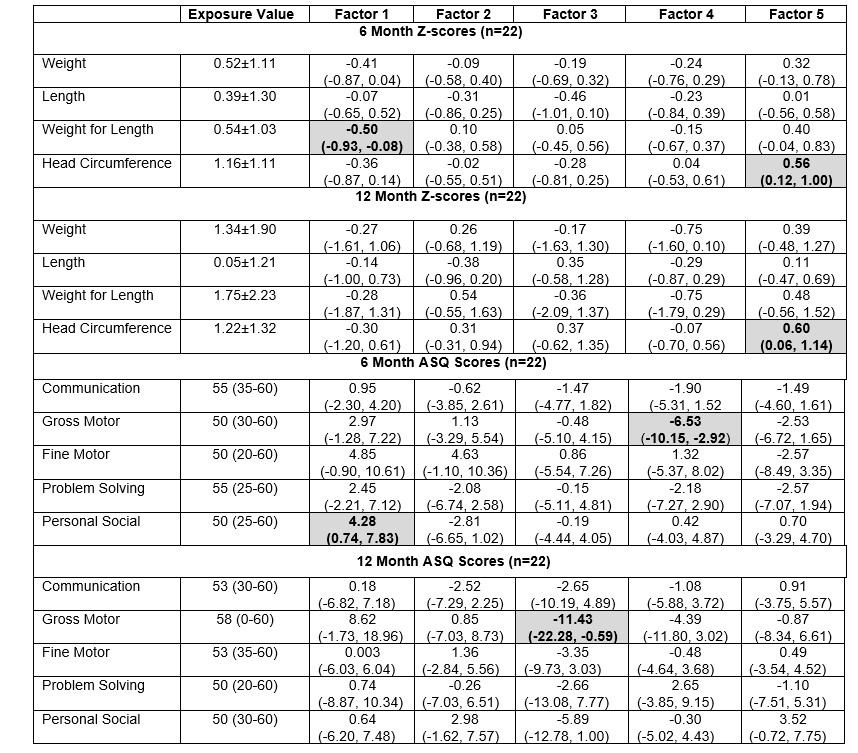 Exposure values are represented as mean±SD for anthropometric z-scores and median (range) for Ages and Stages Questionnaire (ASQ) total scores. Z-scores at 6 and 12 months of age were calculated using actual age for term infants and corrected age for preterm infants utilizing the WHO standard. Linear regression model results are reported as beta estimates (95% CI) indicating change in outcome for each 1 unit increase in metabolomic factor score, adjusting for original study treatment group and maternal BMI. Shaded boxes represent findings for which p<0.05.
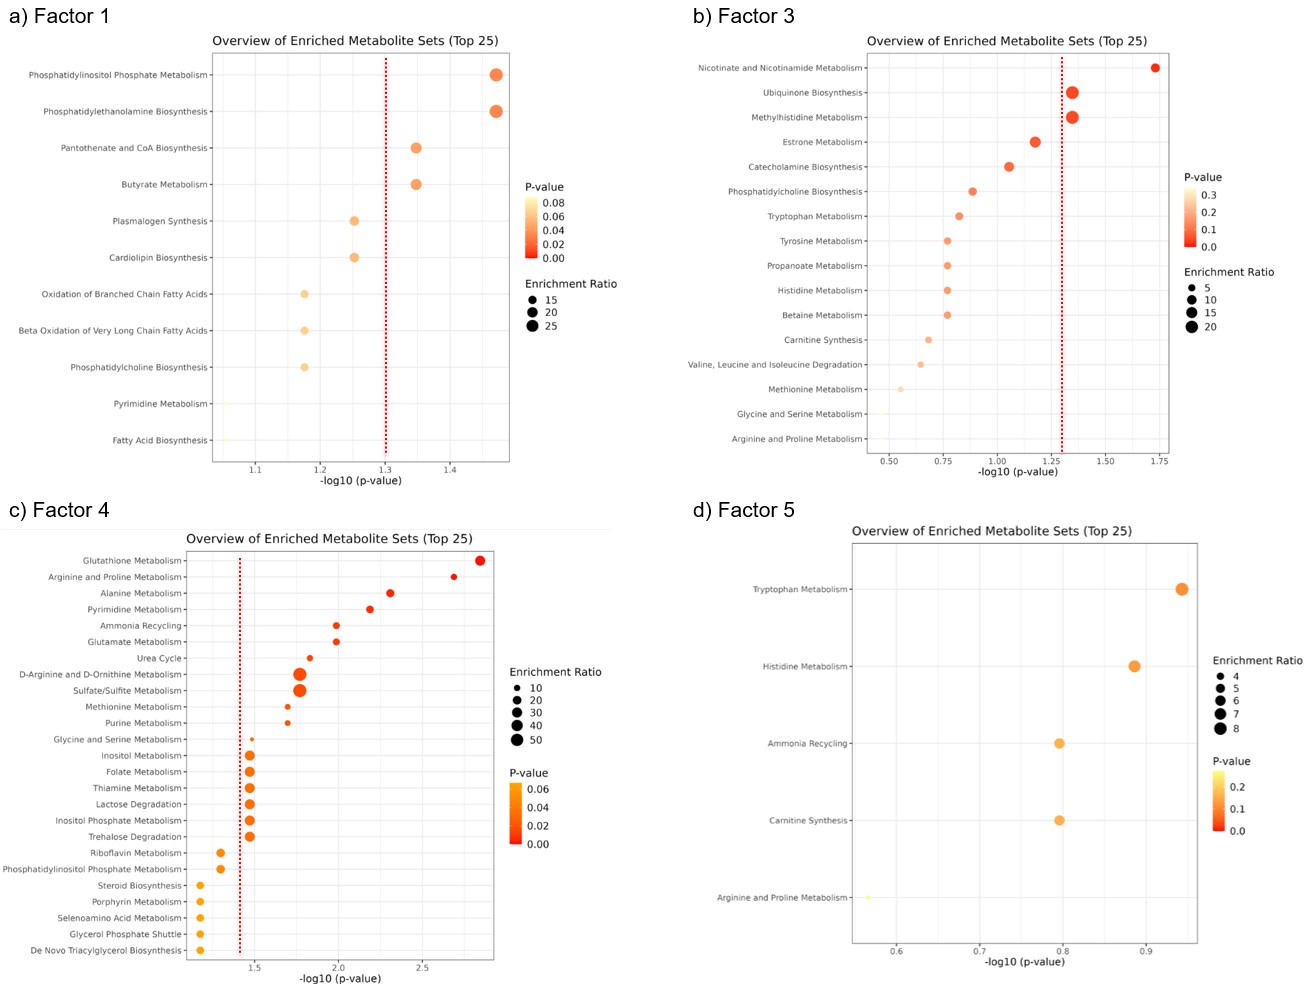 Enrichment ratio: # hits / # expected hits for specific metabolic pathways. Out of the top 15 metabolites a) 9/15 for Factor 1, b) 15/15 for Factor 3, c) 8/15 for Factor 4, and d) 9/15 for Factor 5 were identifiable in MetaboAnalyst 6.0 (https://www.metaboanalyst.ca/) and utilized for Metabolite Set Enrichment Analysis / Over-Representation Analysis. Pathway enrichment with -log10 (P-value) > 1.3 (P-value < 0.05) is considered statistically significant (indicated by dashed red lines).