











Neonatal Quality Improvement 5
Session: Neonatal Quality Improvement 5

Richelle M. Reinhart, MD, MSHS (she/her/hers)
Faculty
The Mount Sinai Kravis Children's Hospital
New York, New York, United States
.png) Figure 1. XbarS charts showing outcome measures, time on intravenous fluids (A) and length of stay (B).
Figure 1. XbarS charts showing outcome measures, time on intravenous fluids (A) and length of stay (B).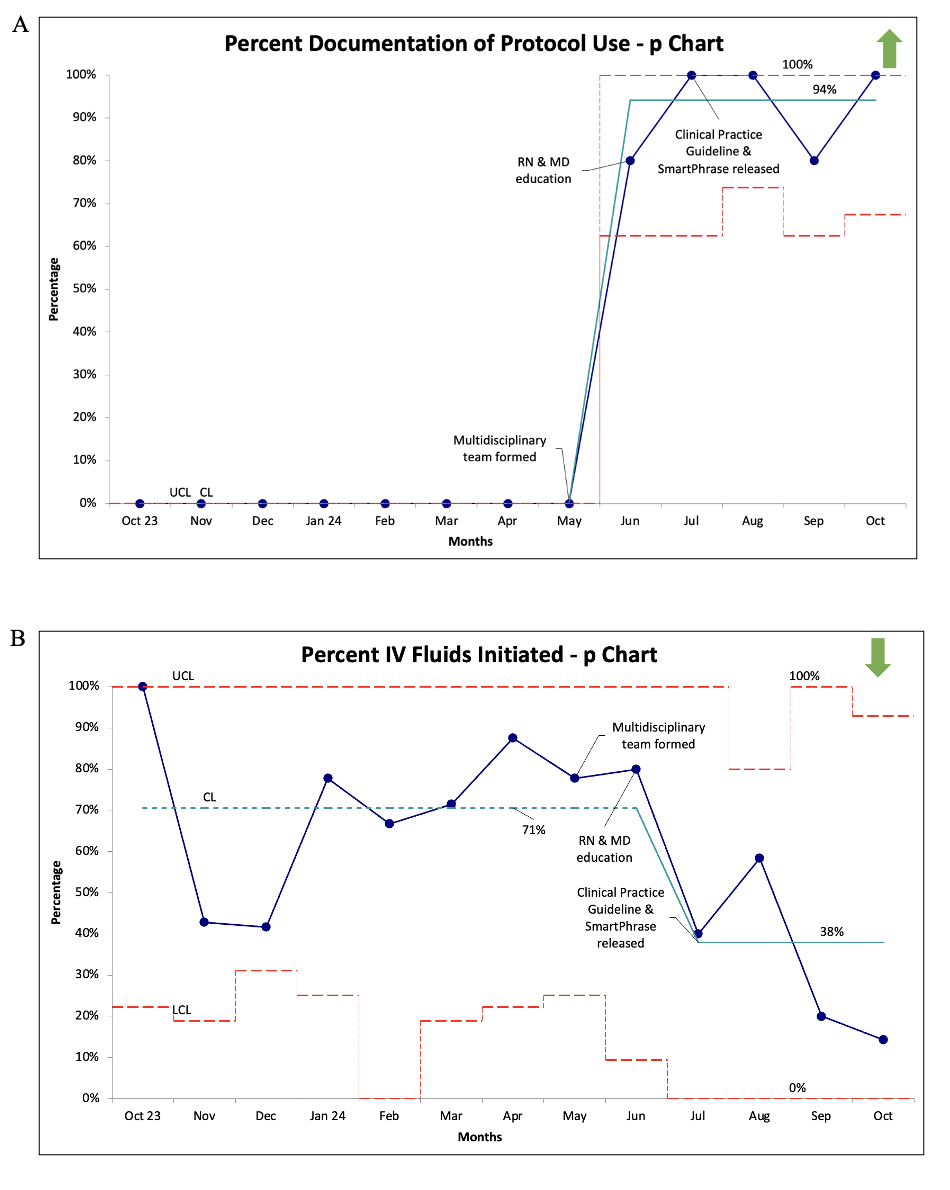 Figure 2. p charts showing process measures, documentation of CPG use in orders or notes (A) and percentage of IVF initiation (B).
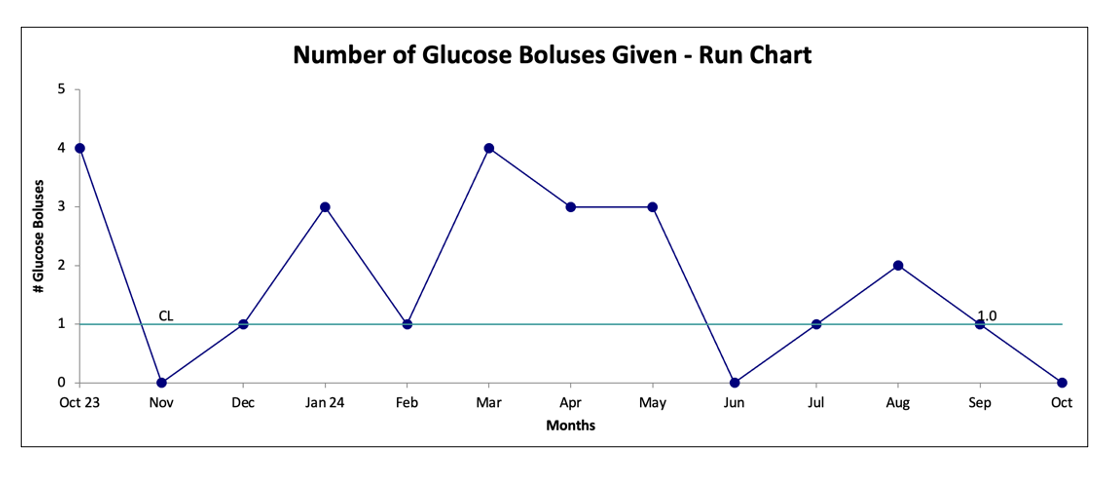 Figure 3. Run chart representing the balancing measure, the number of dextrose boluses administered.