
Quality Improvement/Patient Safety 5
Session: Quality Improvement/Patient Safety 5
 Credit")
 photo")
David Skoglund, MD MS (he/him/his)
Pediatrician
University of Missouri-Kansas City School of Medicine
Shawnee, Kansas, United States
.jpg) These changes to our staffing model were adopted using iterative PDSA cycles.
These changes to our staffing model were adopted using iterative PDSA cycles.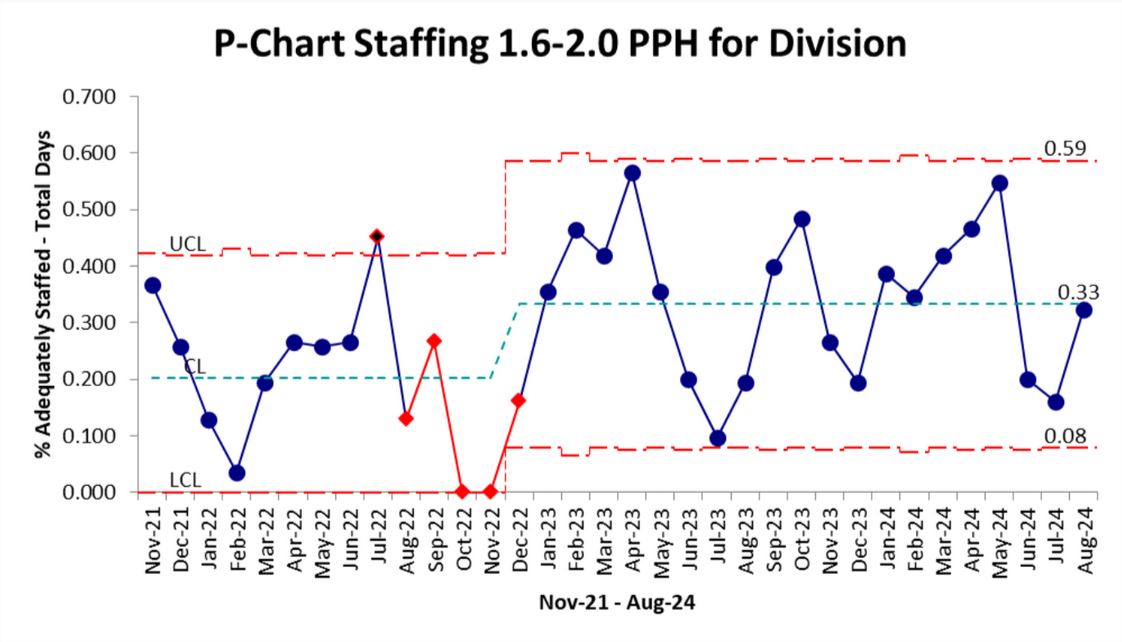 This figure indicates the percentage of appropriately staffed days (1.6-2.0 PPH) throughout our urgent care system over time.
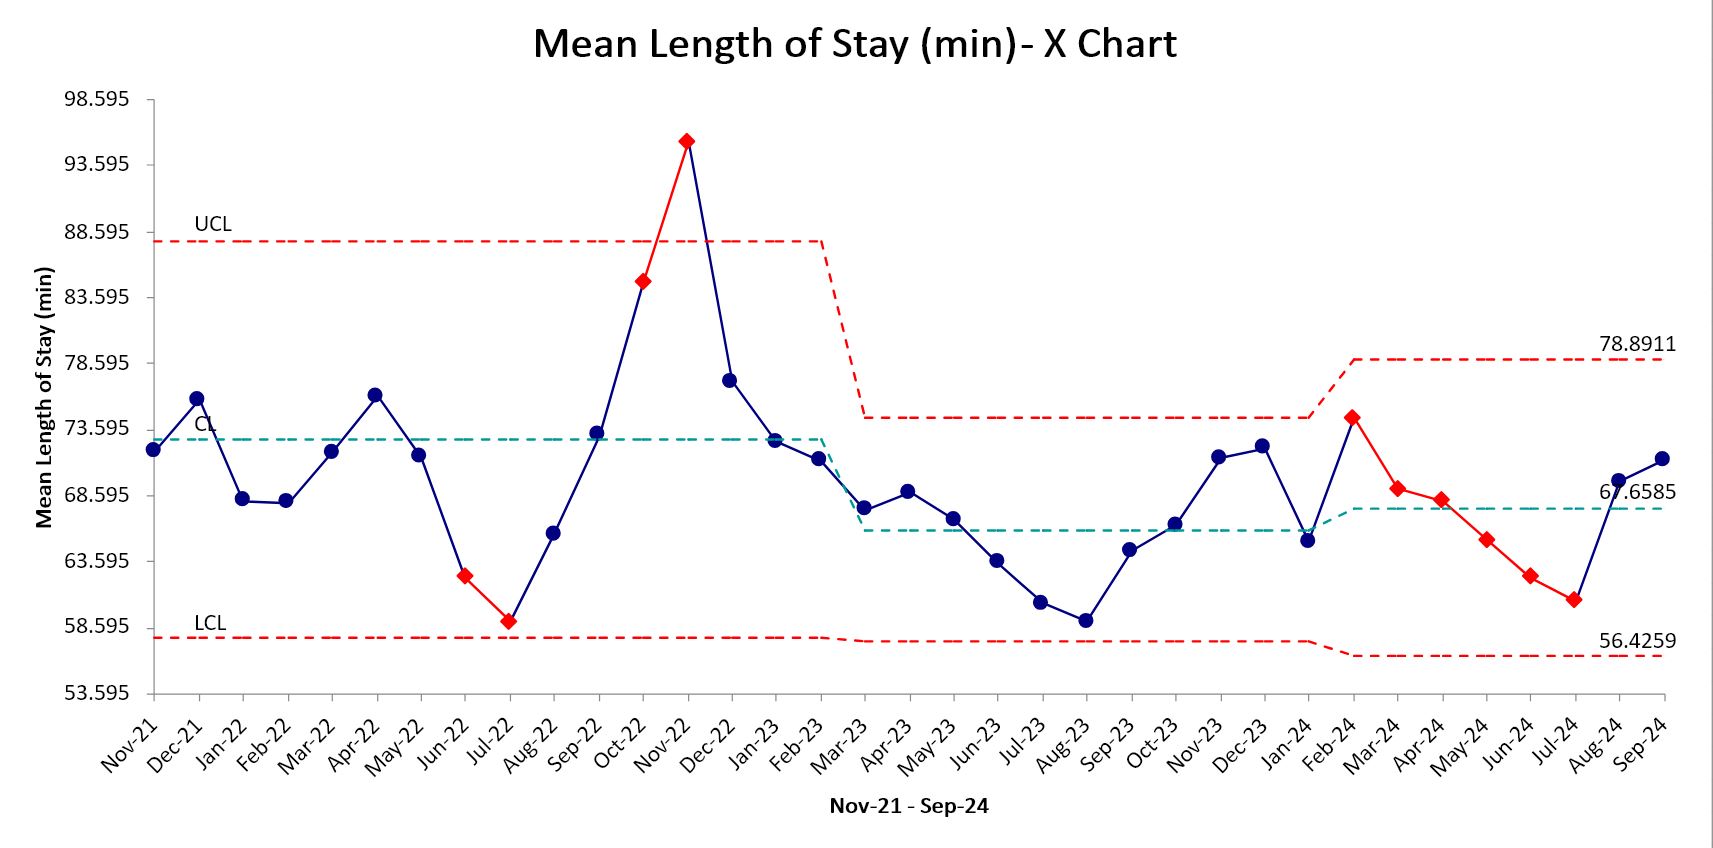 This figure indicates the mean length of stay for patients in our urgent care system over time.These changes to our staffing model were adopted using iterative PDSA cycles.This figure indicates the percentage of appropriately staffed days (1.6-2.0 PPH) throughout our urgent care system over time.This figure indicates the mean length of stay for patients in our urgent care system over time.