Session: Infectious Diseases 4: Improving antibiotic use
142 - Pediatric Infectious Disease Hospitalizations in California: 1985-2014
Saturday, April 26, 2025
2:30pm – 4:45pm HST
Publication Number: 142.6316
Sara H. Goodman, Stanford University School of Medicine, San Jose, CA, United States; Jennifer S. Read, University of California at San Francisco, San Francisco, CA, United States; Yvonne A. Maldonado, Stanford University School of Medicine, Stanford, CA, United States
Research Epidemiologist Stanford University School of Medicine San Jose, California, United States
Background: California has 12% of the nation’s births and a diverse population. Objective: Our objective was to describe and evaluate trends in infectious disease (ID) hospitalizations among pediatric patients (0-17 years old) in California. Design/Methods: We analyzed the Office of Statewide Health Planning and Development (OSHPD) database of California hospitalizations over 30 years (1985-2014). This database comprises records of all hospitalizations from all state-licensed hospitals in California. For each hospitalization, the following were reviewed: age at and year of hospital admission and hospital discharge diagnosis codes. Hospitalizations in acute care facilities old were analyzed, according to age in years (infants: < 1; children: 1-11; adolescents: 12-17) and decade (1985-1994, 1995-2004, 2005-2014) at hospital admission. An ID hospitalization was defined as one with any ID discharge diagnosis code in the first five discharge diagnosis codes. Each hospitalization was categorized as an ID or non-ID hospitalization. Population-based infection rates were calculated using US Census Bureau data from the decennial census and intercensal estimates per 100,000 population. The ptrend and nptrend commands in Stata 18 were used to test for trends in proportions. Results: From 1985-2014, there were 24,293,944 pediatric hospitalizations (Table 1), of which 3,283,766 (15.63%) were ID hospitalizations. ID hospitalizations as a proportion of all hospitalizations was similar across the three decades (p=0.47). However, the proportion of ID hospitalizations varied significantly according to age group (infants: 7.44%; children: 41.24%; adolescents: 18.28%; p-value for trend: < 0.001). When restricting ID hospitalizations to those with a primary discharge diagnosis of an infectious disease (1,862,203), the most common ID diagnoses were pneumonia and appendicitis during each decade (Table 2A; Figure 1). Pneumonia was the most common diagnosis for infants and children, and acute appendicitis was the most common diagnosis for adolescents. The ID hospitalization rate per 100,000 population (Table 2B) ranged between 165.95 and 233.53 according to decade (p=0.42) and appeared to decrease with increasing age (infants: 4625.49, children: 476.87, adolescents: 38.87; p =0.24).
Conclusion(s): We did not observe major changes in ID hospitalizations over time or by age, with the exception of a statistically significant trend with regard to the proportion of ID hospitalizations according to age group.
Table 1: Pediatric hospitalizations in California (1985-2014) 
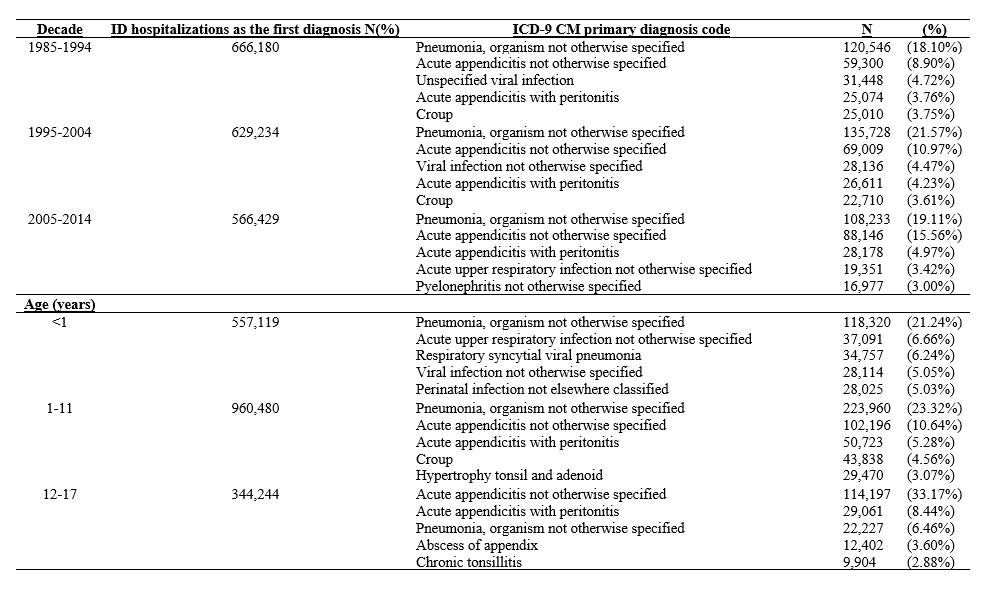
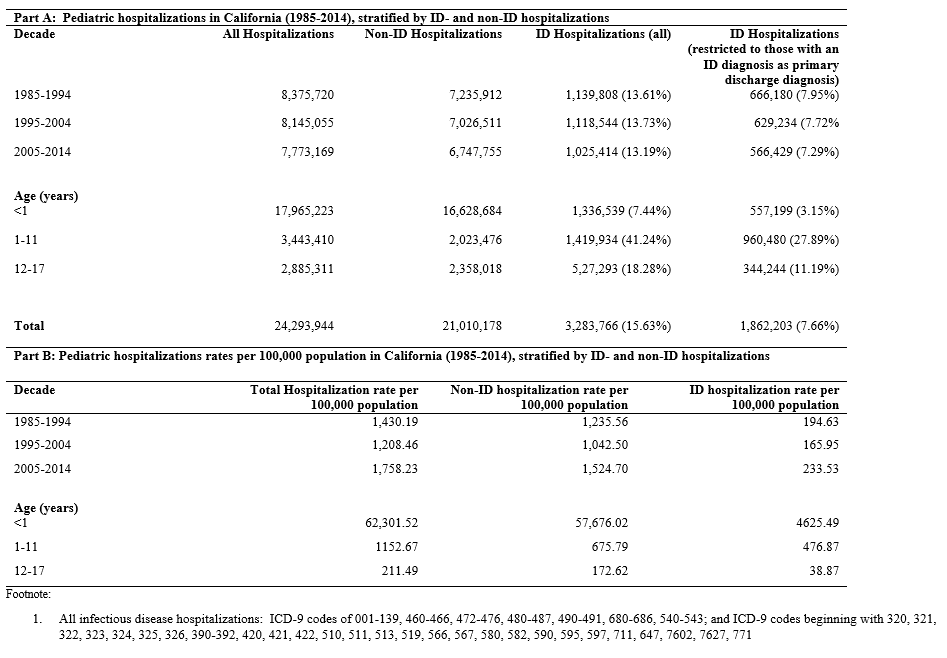
All infectious disease hospitalizations: ICD-9 codes of 001-139, 460-466, 472-476, 480-487, 490-491, 680-686, 540-543; and ICD-9 codes beginning with 320, 321, 322, 323, 324, 325, 326, 390-392, 420, 421, 422, 510, 511, 513, 519, 566, 567, 580, 582, 590, 595, 597, 711, 647, 7602, 7627, 771
Table 2: Top five discharge diagnoses among ID hospitalizations (restricted to those with an ID diagnosis as primary discharge diagnosis)
Figure 1: Clustered bar graphs of ID diagnoses (primary discharge diagnosis), stratified by decade and age group