
Neo-Perinatal Health Care Delivery: Practices and Procedures 3
Session: Neo-Perinatal Health Care Delivery: Practices and Procedures 3
 photo")
Praveen Chandrasekharan, MD, MS (he/him/his)
Associate Professor of Pediatrics
Jacobs School of Medicine and Biomedical Sciences at the University at Buffalo
Buffalo, New York, United States
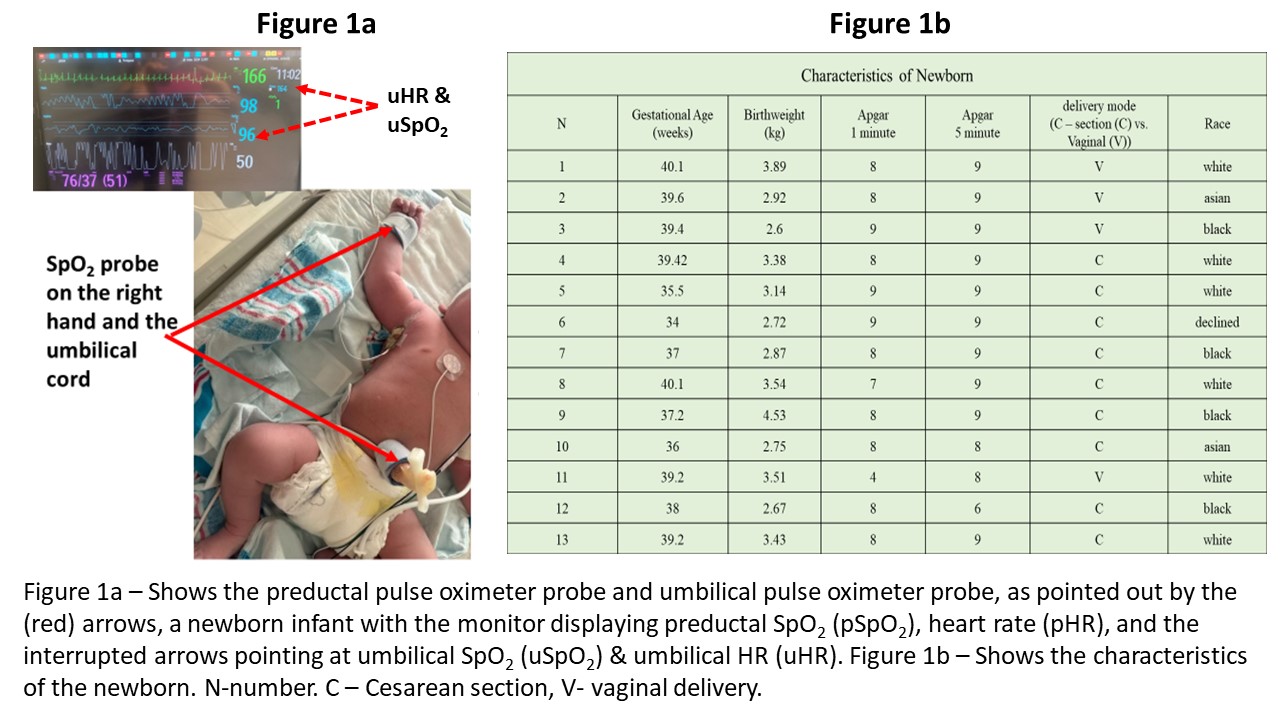 Figure 1a – Shows the preductal pulse oximeter probe and umbilical pulse oximeter probe, as pointed out by the (red) arrows, a newborn infant with the monitor displaying preductal SpO2 (pSpO2), heart rate (pHR), and the interrupted arrows pointing at umbilical SpO2 (uSpO2) & umbilical HR (uHR). Figure 1b – Shows the characteristics of the newborn. N-number. C – Cesarean section, V- vaginal delivery.
.jpg) Figure 2a – Shows the bland-altman (BA) plot between preductal SpO2 (pSpO2) & umbilical SpO2 (uSpO2) with bias -2.6 (95% confidence interval -5.20,0.01) showing agreement between the two models. Figure 2b – Shows the receiver operator curve for preductal SpO2 (pSpO2) & umbilical SpO2 (uSpO2) with significant area under the curve (AUC=0.907,p < 0.01).
Figure 2a – Shows the bland-altman (BA) plot between preductal SpO2 (pSpO2) & umbilical SpO2 (uSpO2) with bias -2.6 (95% confidence interval -5.20,0.01) showing agreement between the two models. Figure 2b – Shows the receiver operator curve for preductal SpO2 (pSpO2) & umbilical SpO2 (uSpO2) with significant area under the curve (AUC=0.907,p < 0.01)..jpg) Figure 3a – Shows the bland-altman (BA) plot between preductal heart rate (pHR), & umbilical HR (uHR) with bias -17.7 (95% confidence interval -29,-6) showing agreement between the two models. Figure 3b – Shows the receiver operator curve for preductal heart rate (pHR), & umbilical HR (uHR) with a significant area under the curve (AUC=0.842,p < 0.01).
Figure 3a – Shows the bland-altman (BA) plot between preductal heart rate (pHR), & umbilical HR (uHR) with bias -17.7 (95% confidence interval -29,-6) showing agreement between the two models. Figure 3b – Shows the receiver operator curve for preductal heart rate (pHR), & umbilical HR (uHR) with a significant area under the curve (AUC=0.842,p < 0.01).