
Neonatal Fetal Nutrition & Metabolism 4
Session: Neonatal Fetal Nutrition & Metabolism 4

Ting Ting Fu, MD
Associate Professor of Pediatrics
Cincinnati Children's Hospital Medical Center
Cincinnati, Ohio, United States
.jpg) SGA: small for gestational age; AGA: adequate for gestational age; LGA: large for gestational age. p<0.05 for all INTERGROWTH and Fenton regression coefficients representing SGA, AGA and LGA groups.
SGA: small for gestational age; AGA: adequate for gestational age; LGA: large for gestational age. p<0.05 for all INTERGROWTH and Fenton regression coefficients representing SGA, AGA and LGA groups.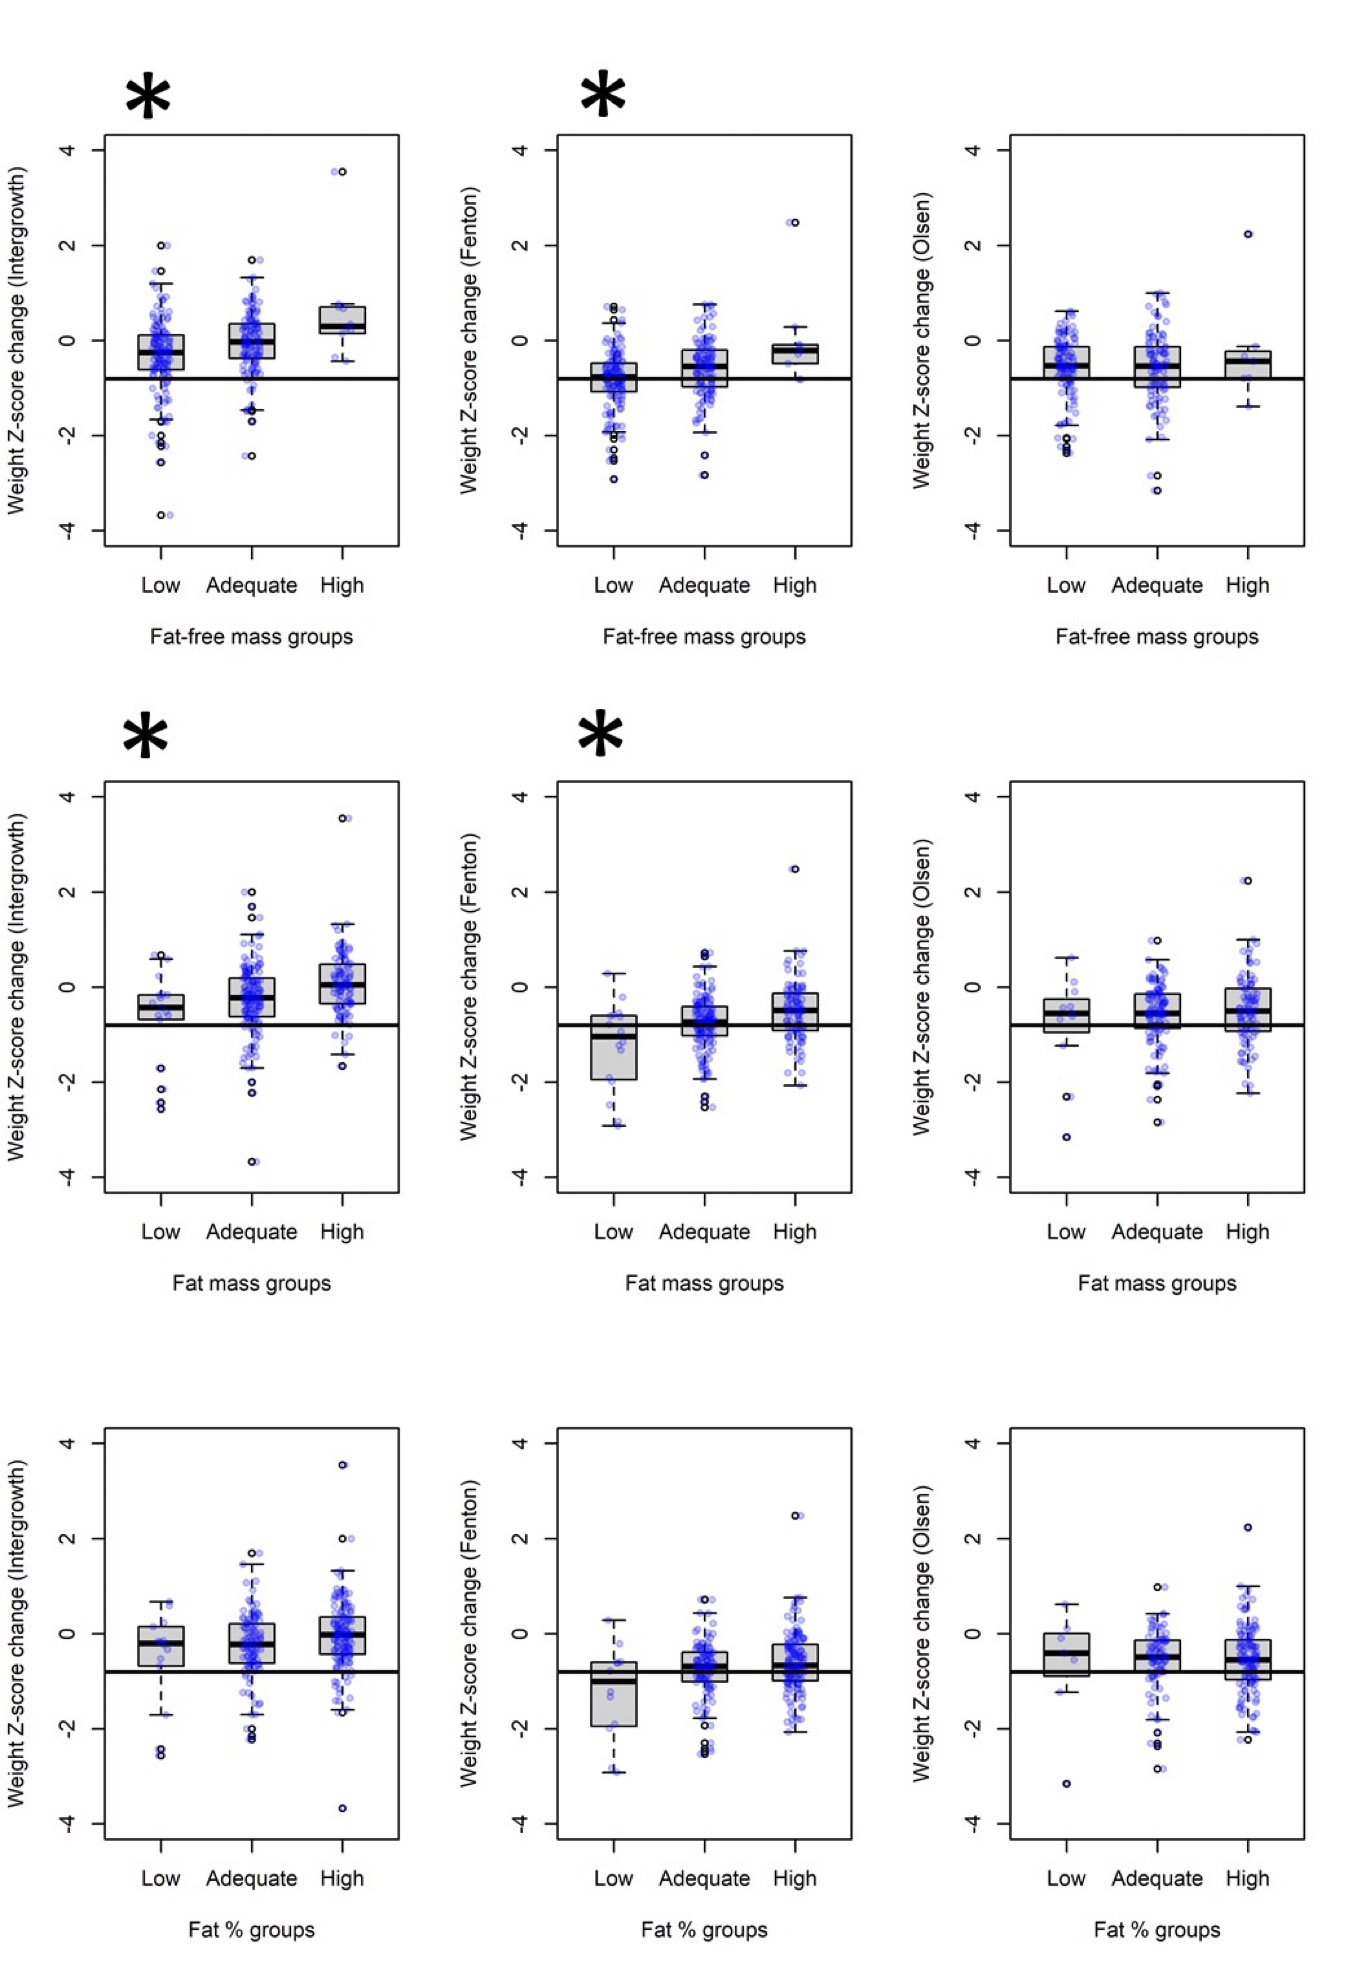 The solid black horizontal line is the weight Z-score cutoff value for malnutrition diagnosis, -0.8. *p < 0.05 for comparisons of the weight Z-score changes from INTERGROWTH chart and Fenton chart among fat-free mass and fat mass categories. Comparing Fenton and INTERGROWTH and considering malnutrition as a binary outcome, Fenton classified more malnutrition in infants with low fat-free mass (46.1% vs. 16.4%, p<0.0001), while INTERGROWTH classified more non-malnourished cases in infants with high fat mass (94.8% vs. 69%, p<0.0001).
 SGA: small for gestational age; AGA: adequate for gestational age; LGA: large for gestational age. p<0.05 for all INTERGROWTH and Fenton regression coefficients representing SGA, AGA and LGA groups.The solid black horizontal line is the weight Z-score cutoff value for malnutrition diagnosis, -0.8. *p < 0.05 for comparisons of the weight Z-score changes from INTERGROWTH chart and Fenton chart among fat-free mass and fat mass categories. Comparing Fenton and INTERGROWTH and considering malnutrition as a binary outcome, Fenton classified more malnutrition in infants with low fat-free mass (46.1% vs. 16.4%, p<0.0001), while INTERGROWTH classified more non-malnourished cases in infants with high fat mass (94.8% vs. 69%, p<0.0001).