
Neonatal General 13: Retinopathy of Prematurity
Session: Neonatal General 13: Retinopathy of Prematurity
 photo")
Michael R. Vitti (he/him/his)
Medical Student
University of Virginia School of Medicine
Charlottesville, Virginia, United States
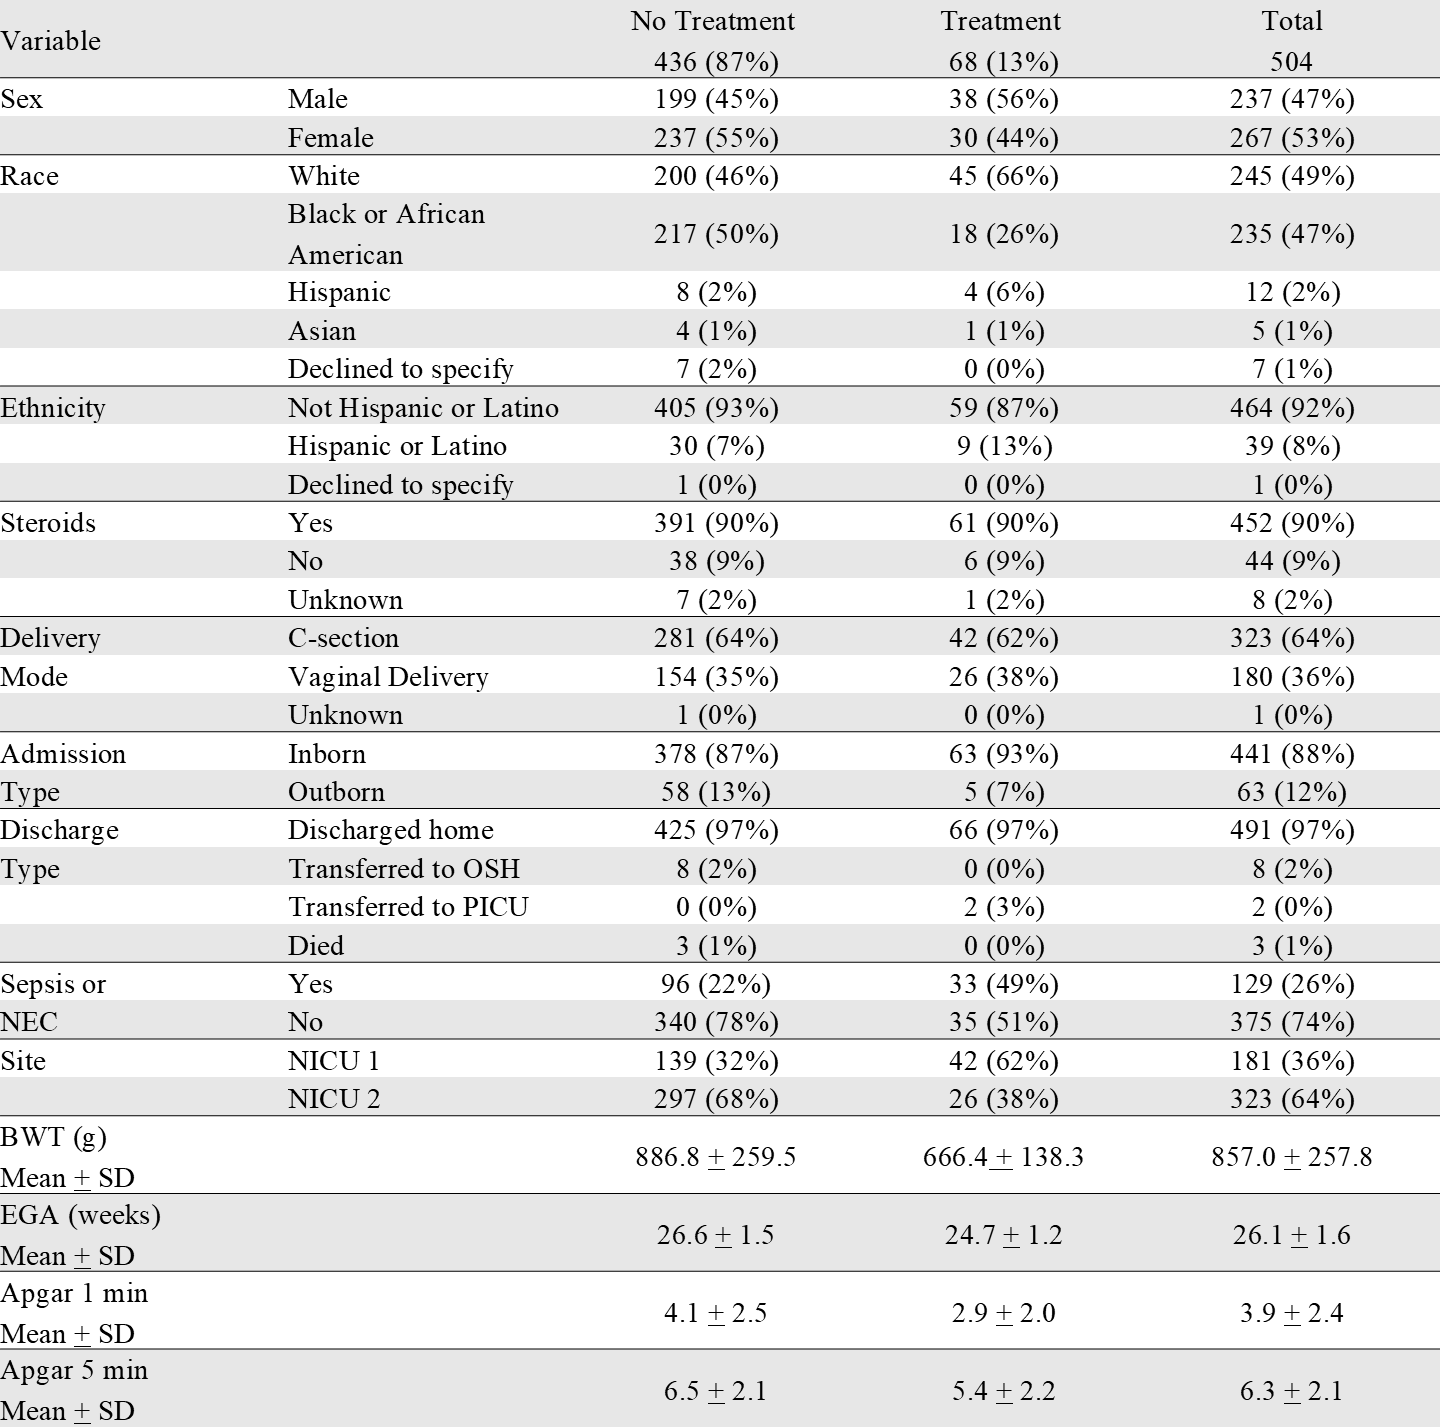 Distribution of categorical and continuous demographic variables among ROP treatment groups.
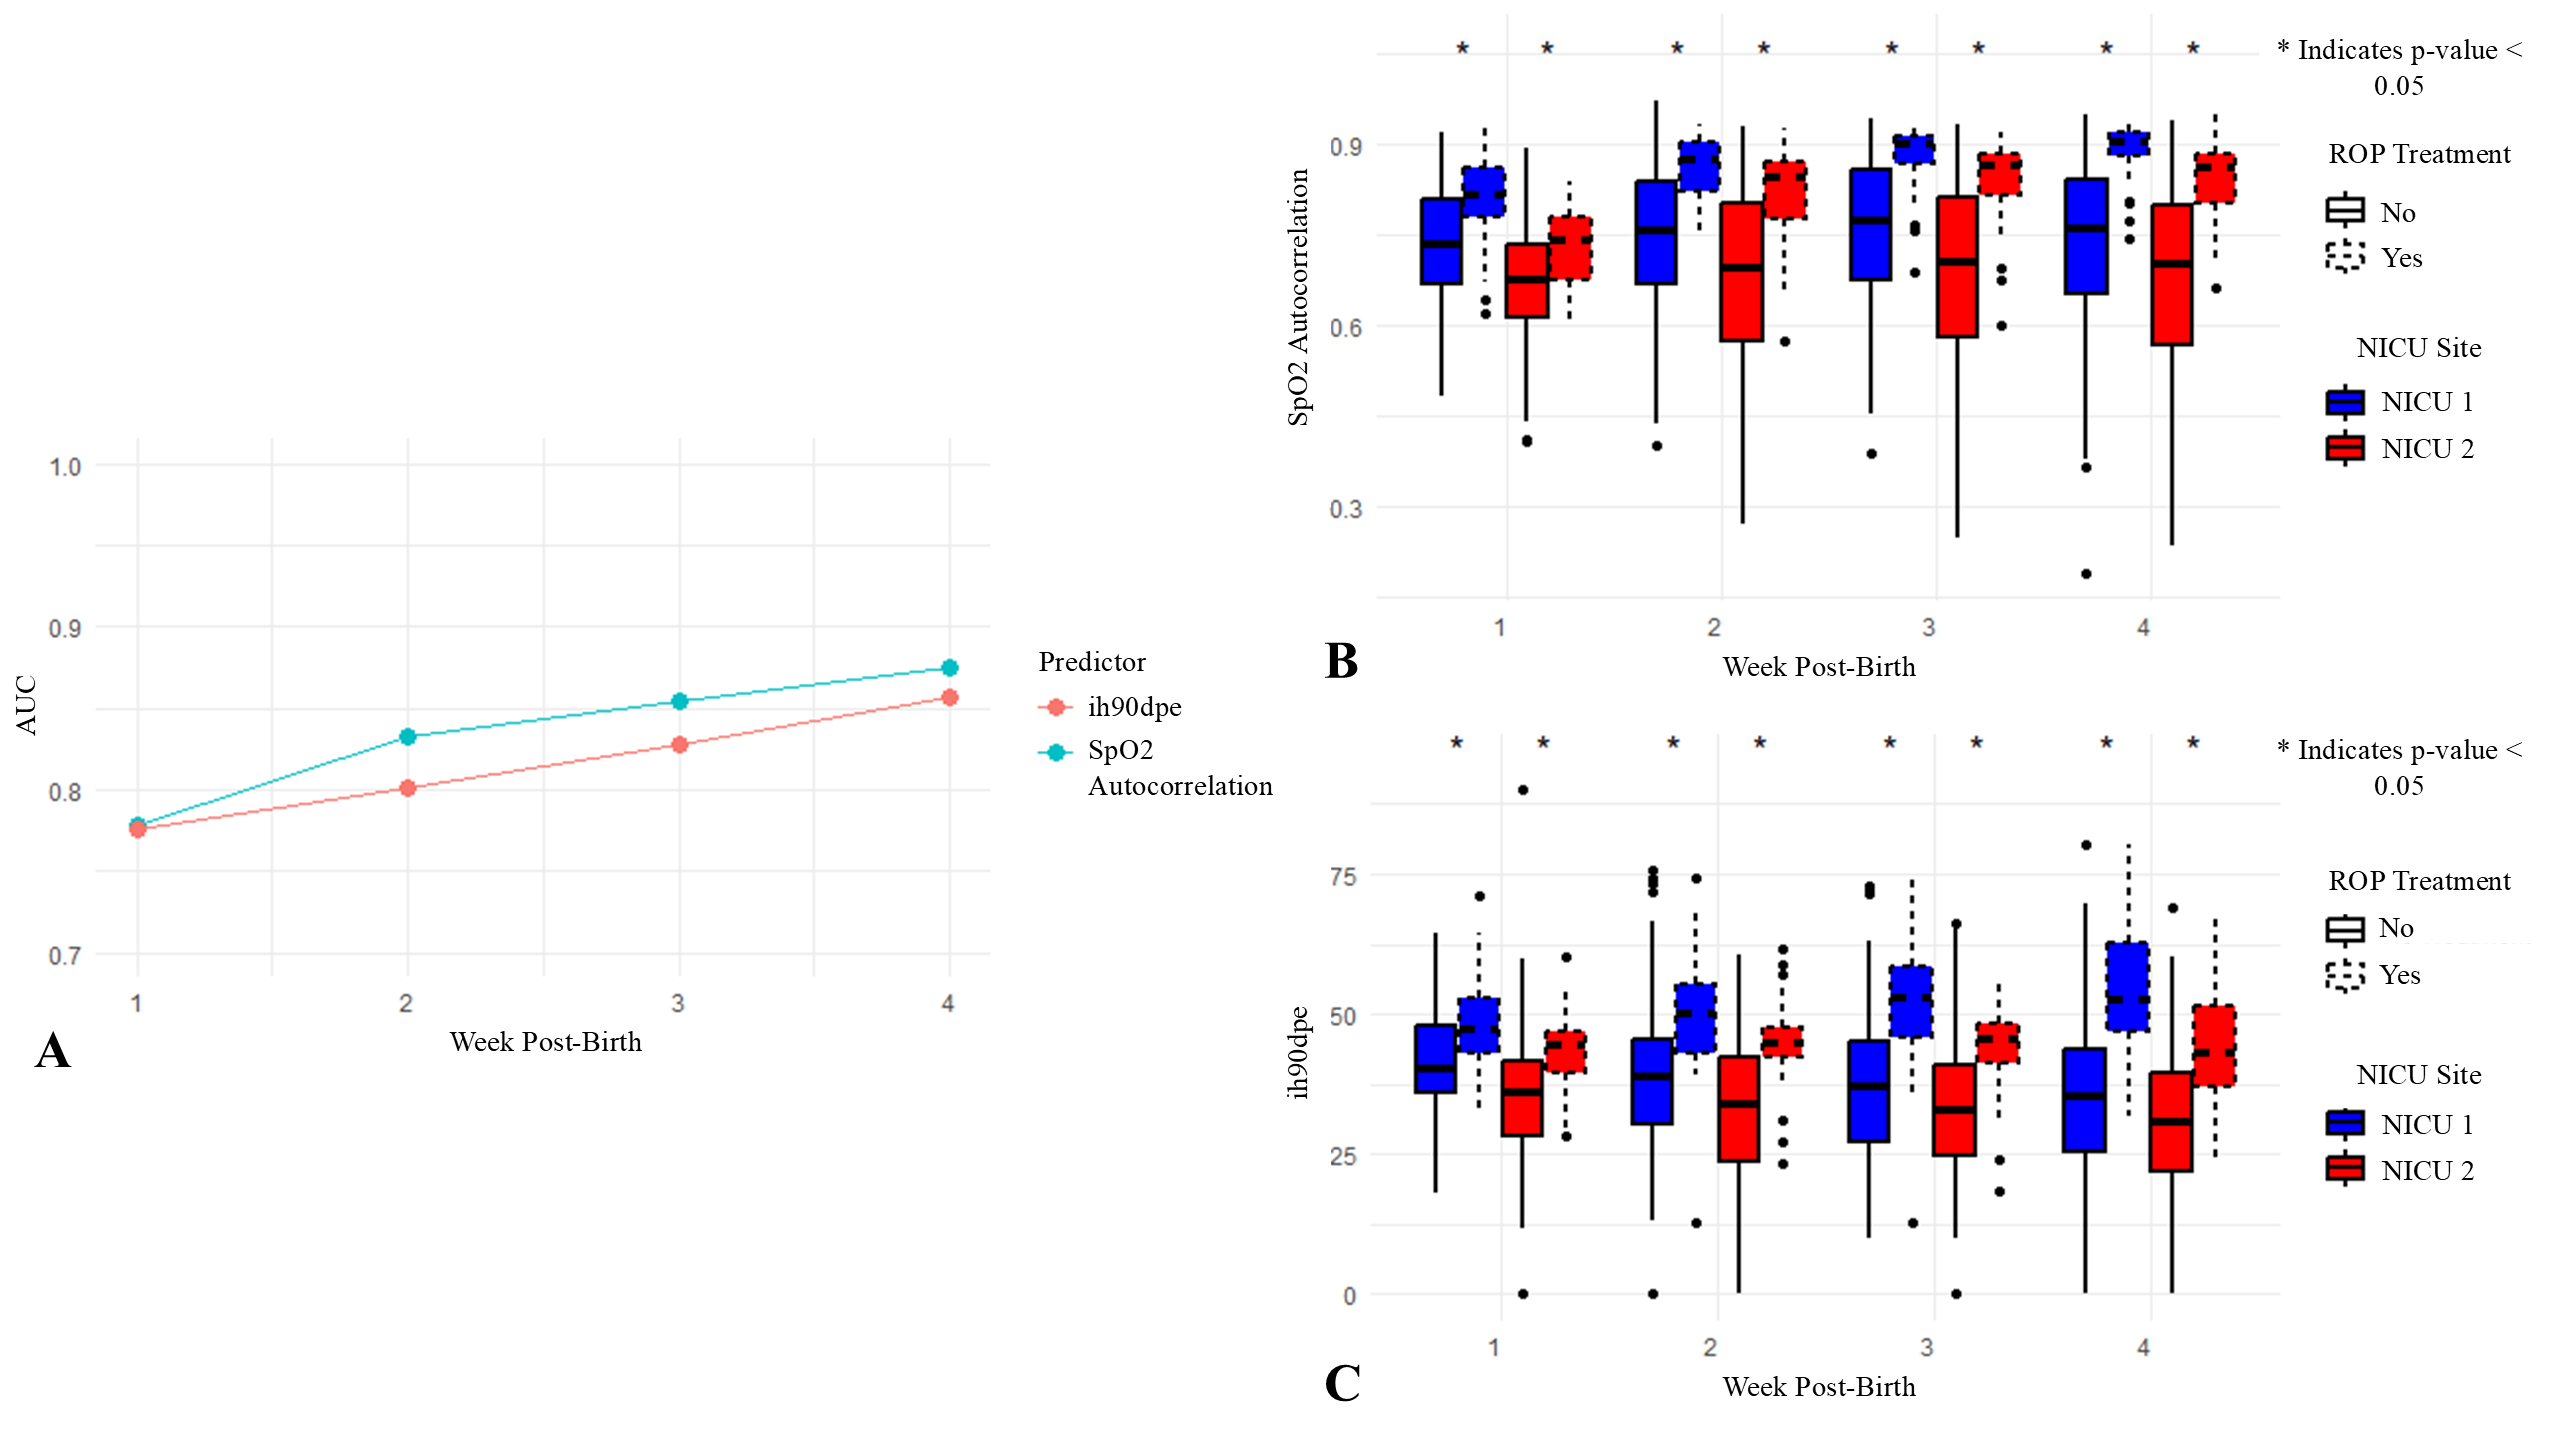 (A) AUC values for logistic regression models predicting treatment for ROP across weeks 1-4 post-birth. Two predictors, SpO2 autocorrelation and IH90DPE, were evaluated separately in the models. SpO2 autocorrelation measures the similarity of SpO2 values over time, with higher values indicating prolonged periods of similar SpO2 levels, which may correspond to sustained hypoxemia and greater respiratory instability. IH90DPE represents the cumulative duration per event that SpO2 levels are maintained below 90%. (B) and (C) Box plots display the SpO2 autocorrelation and IH90DPE values, respectively, for neonates across weeks 1-4 post-birth, separated by NICU site and ROP treatment group. Asterisks (*) above boxes indicate significant differences in autocorrelation or IH90DPE between treatment groups within each NICU site and week (p <0.05, Mann-Whitney U test).
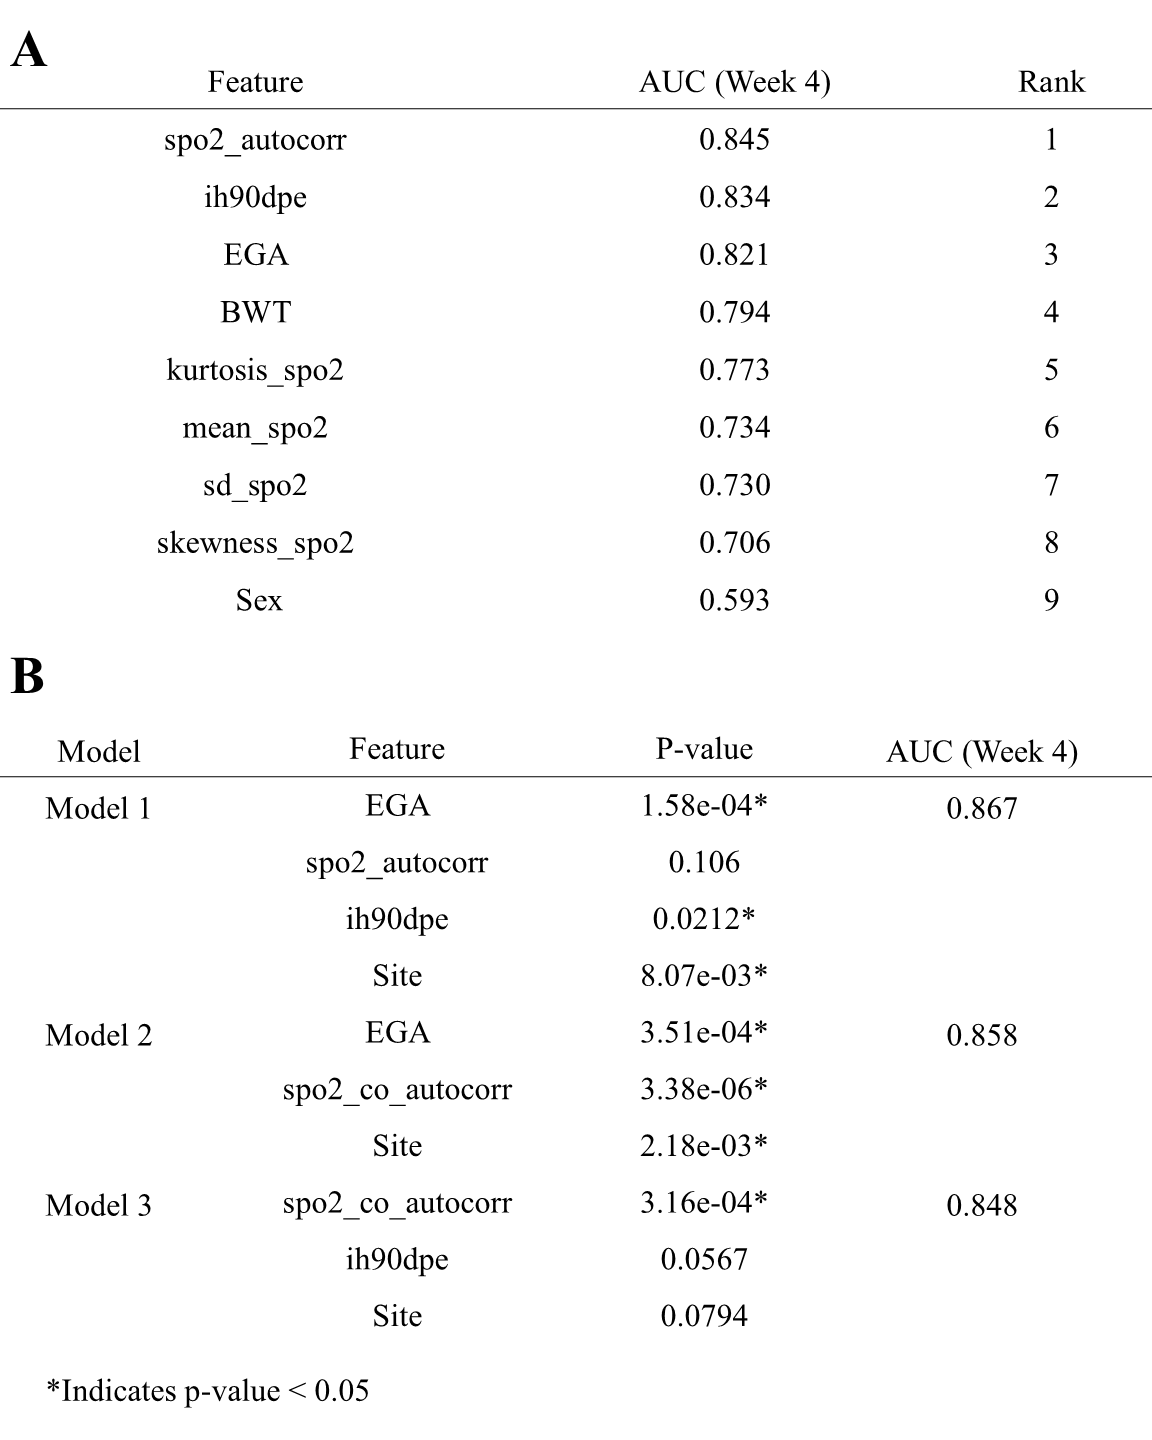 (A) AUC values for logistic regression models predicting ROP treatment based on individual predictors. Each model includes a single feature combined with site as a covariate. The AUC values were calculated using 10-fold cross-validation with predefined folds. (B) AUC values and corresponding p-values for logistic regression models incorporating combinations of predictors. Models were evaluated using fixed 10-fold cross-validation, with each predictor’s statistical significance indicated by p-values derived from model coefficients. Significant p-values (p <0.05) denote predictors that significantly contributed to the model’s accuracy within each cross-validated analysis.Distribution of categorical and continuous demographic variables among ROP treatment groups.(A) AUC values for logistic regression models predicting treatment for ROP across weeks 1-4 post-birth. Two predictors, SpO2 autocorrelation and IH90DPE, were evaluated separately in the models. SpO2 autocorrelation measures the similarity of SpO2 values over time, with higher values indicating prolonged periods of similar SpO2 levels, which may correspond to sustained hypoxemia and greater respiratory instability. IH90DPE represents the cumulative duration per event that SpO2 levels are maintained below 90%. (B) and (C) Box plots display the SpO2 autocorrelation and IH90DPE values, respectively, for neonates across weeks 1-4 post-birth, separated by NICU site and ROP treatment group. Asterisks (*) above boxes indicate significant differences in autocorrelation or IH90DPE between treatment groups within each NICU site and week (p <0.05, Mann-Whitney U test).(A) AUC values for logistic regression models predicting ROP treatment based on individual predictors. Each model includes a single feature combined with site as a covariate. The AUC values were calculated using 10-fold cross-validation with predefined folds. (B) AUC values and corresponding p-values for logistic regression models incorporating combinations of predictors. Models were evaluated using fixed 10-fold cross-validation, with each predictor’s statistical significance indicated by p-values derived from model coefficients. Significant p-values (p <0.05) denote predictors that significantly contributed to the model’s accuracy within each cross-validated analysis.