Neonatal General 13: Retinopathy of Prematurity
Session: Neonatal General 13: Retinopathy of Prematurity
446 - Predicting Severe Retinopathy of Prematurity in Extremely Preterm Infants Using Oxygen Saturation and Demographic Factors
Monday, April 28, 2025
7:00am - 9:15am HST
Publication Number: 446.6124
Michael R. Vitti, University of Virginia School of Medicine, Charlottesville, VA, United States; Douglas E. Lake, University of Virginia, Charlottesville, VA, United States; Colm P. Travers, UAB, Birmingham, AL, United States; Brynne Sullivan, University of Virginia School of Medicine, Charlottesville, VA, United States

Michael R. Vitti (he/him/his)
Medical Student
University of Virginia School of Medicine
Charlottesville, Virginia, United States
Presenting Author(s)
Background: Retinopathy of prematurity (ROP) is a significant cause of childhood blindness worldwide, particularly affecting extremely preterm infants ( < 29 weeks gestational age). Early identification and timely intervention can help prevent ROP from progressing and causing permanent vision loss. Increased intermittent hypoxemia (IH) has been previously shown to increase ROP risk in a single-center study of 79 infants with 16 events (PMID 20304417). Recent advances in continuous oxygen saturation (SpO2) data analysis could improve ROP risk prediction over prematurity and demographic risk factors.
Objective: To determine whether SpO2 patterns in the first 4 weeks after birth add information above demographics on the risk of severe ROP treated with laser or intravitreal bevacizumab in extremely premature neonates at two centers with different ROP treatment rates.
Design/Methods: We studied extremely premature infants admitted to two NICUs from 2017 to 2023 with SpO2 data available, excluding those who left the NICU or died before 28 days of age. From SpO2 data sampled every two seconds, we calculated 6 features on 10-min windows that we previously identified as signatures of respiratory illness (PMID 37219236) including a novel autocorrelation measure of IH discovered using highly comparative time series analysis (HCTSA). We used multivariable logistic regression to characterize the associations between birth weight, gestational age, sex, and SpO2 features summarized as the weekly median, controlling for site. We evaluated the added predictive value of SpO2 features to demographics by comparing values of the area under the receiver operating characteristic curve (AUC) with 10-fold cross-validation to adjust for over-fitting.
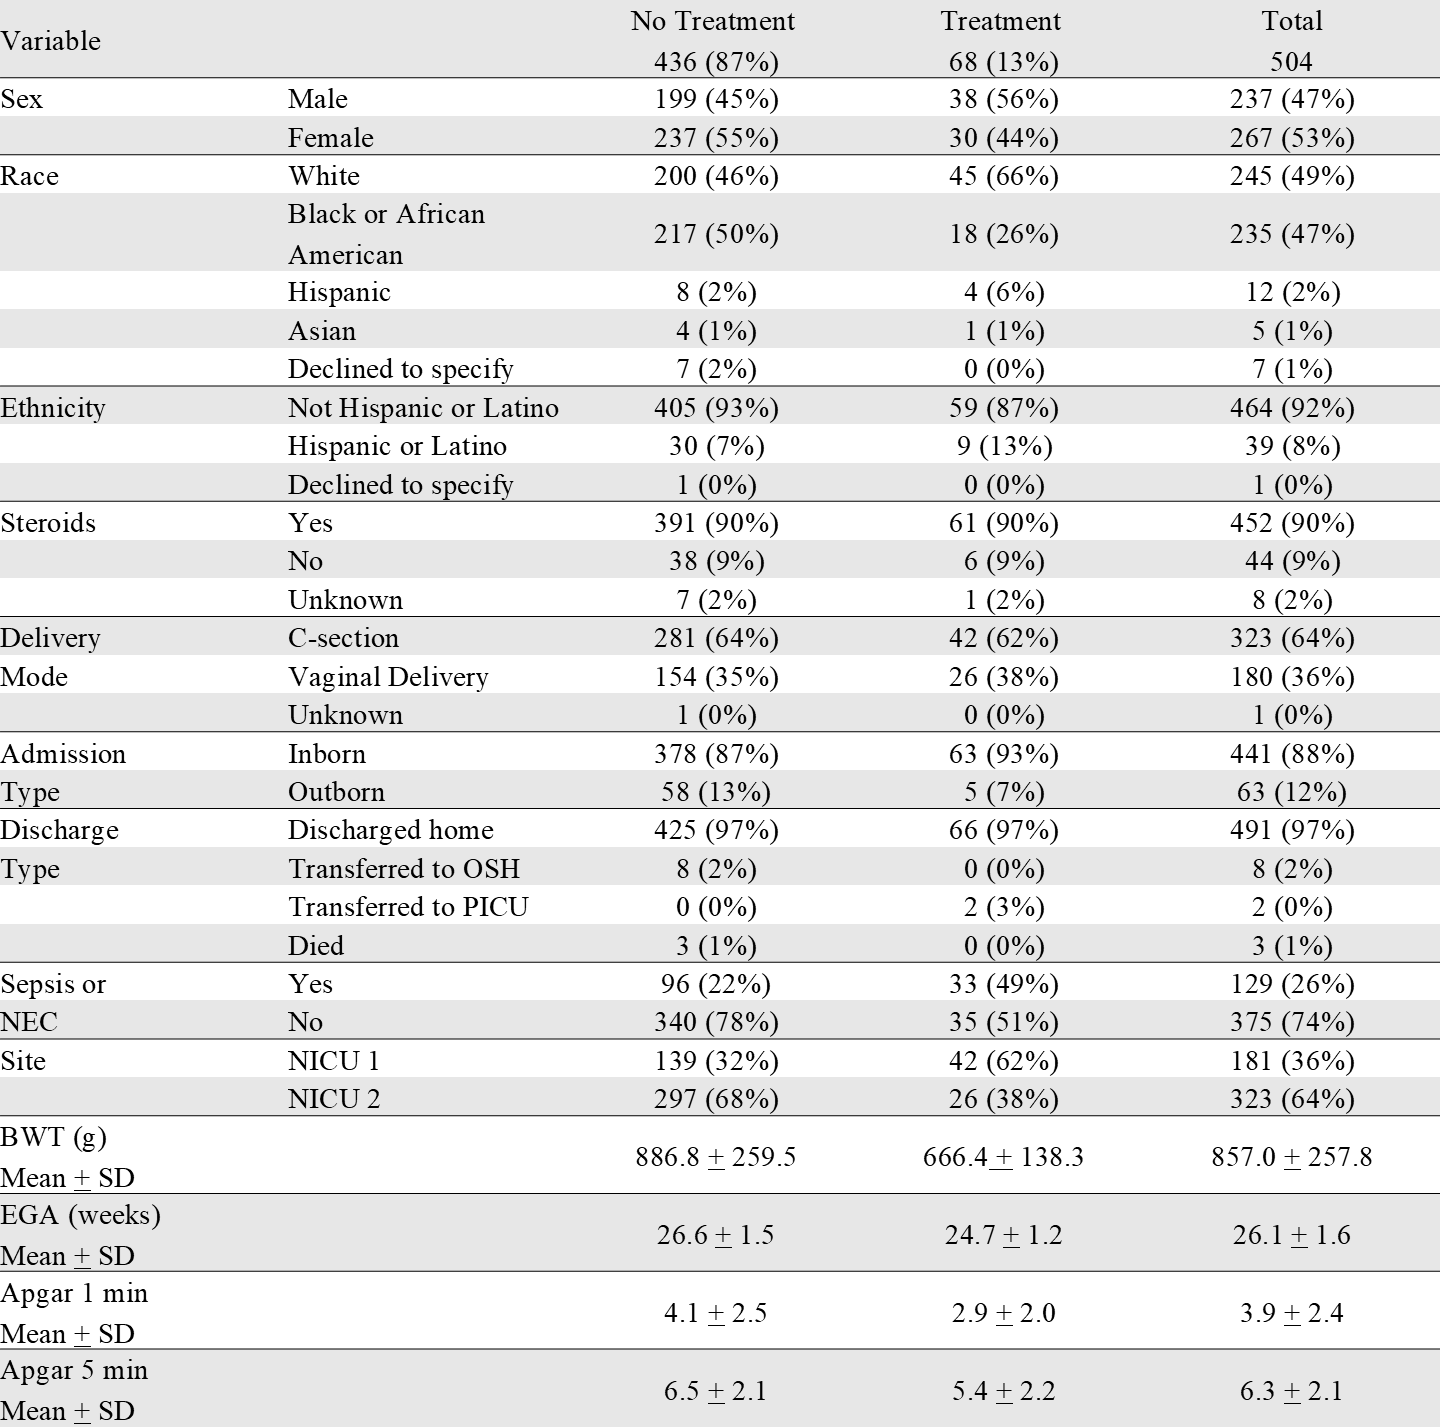
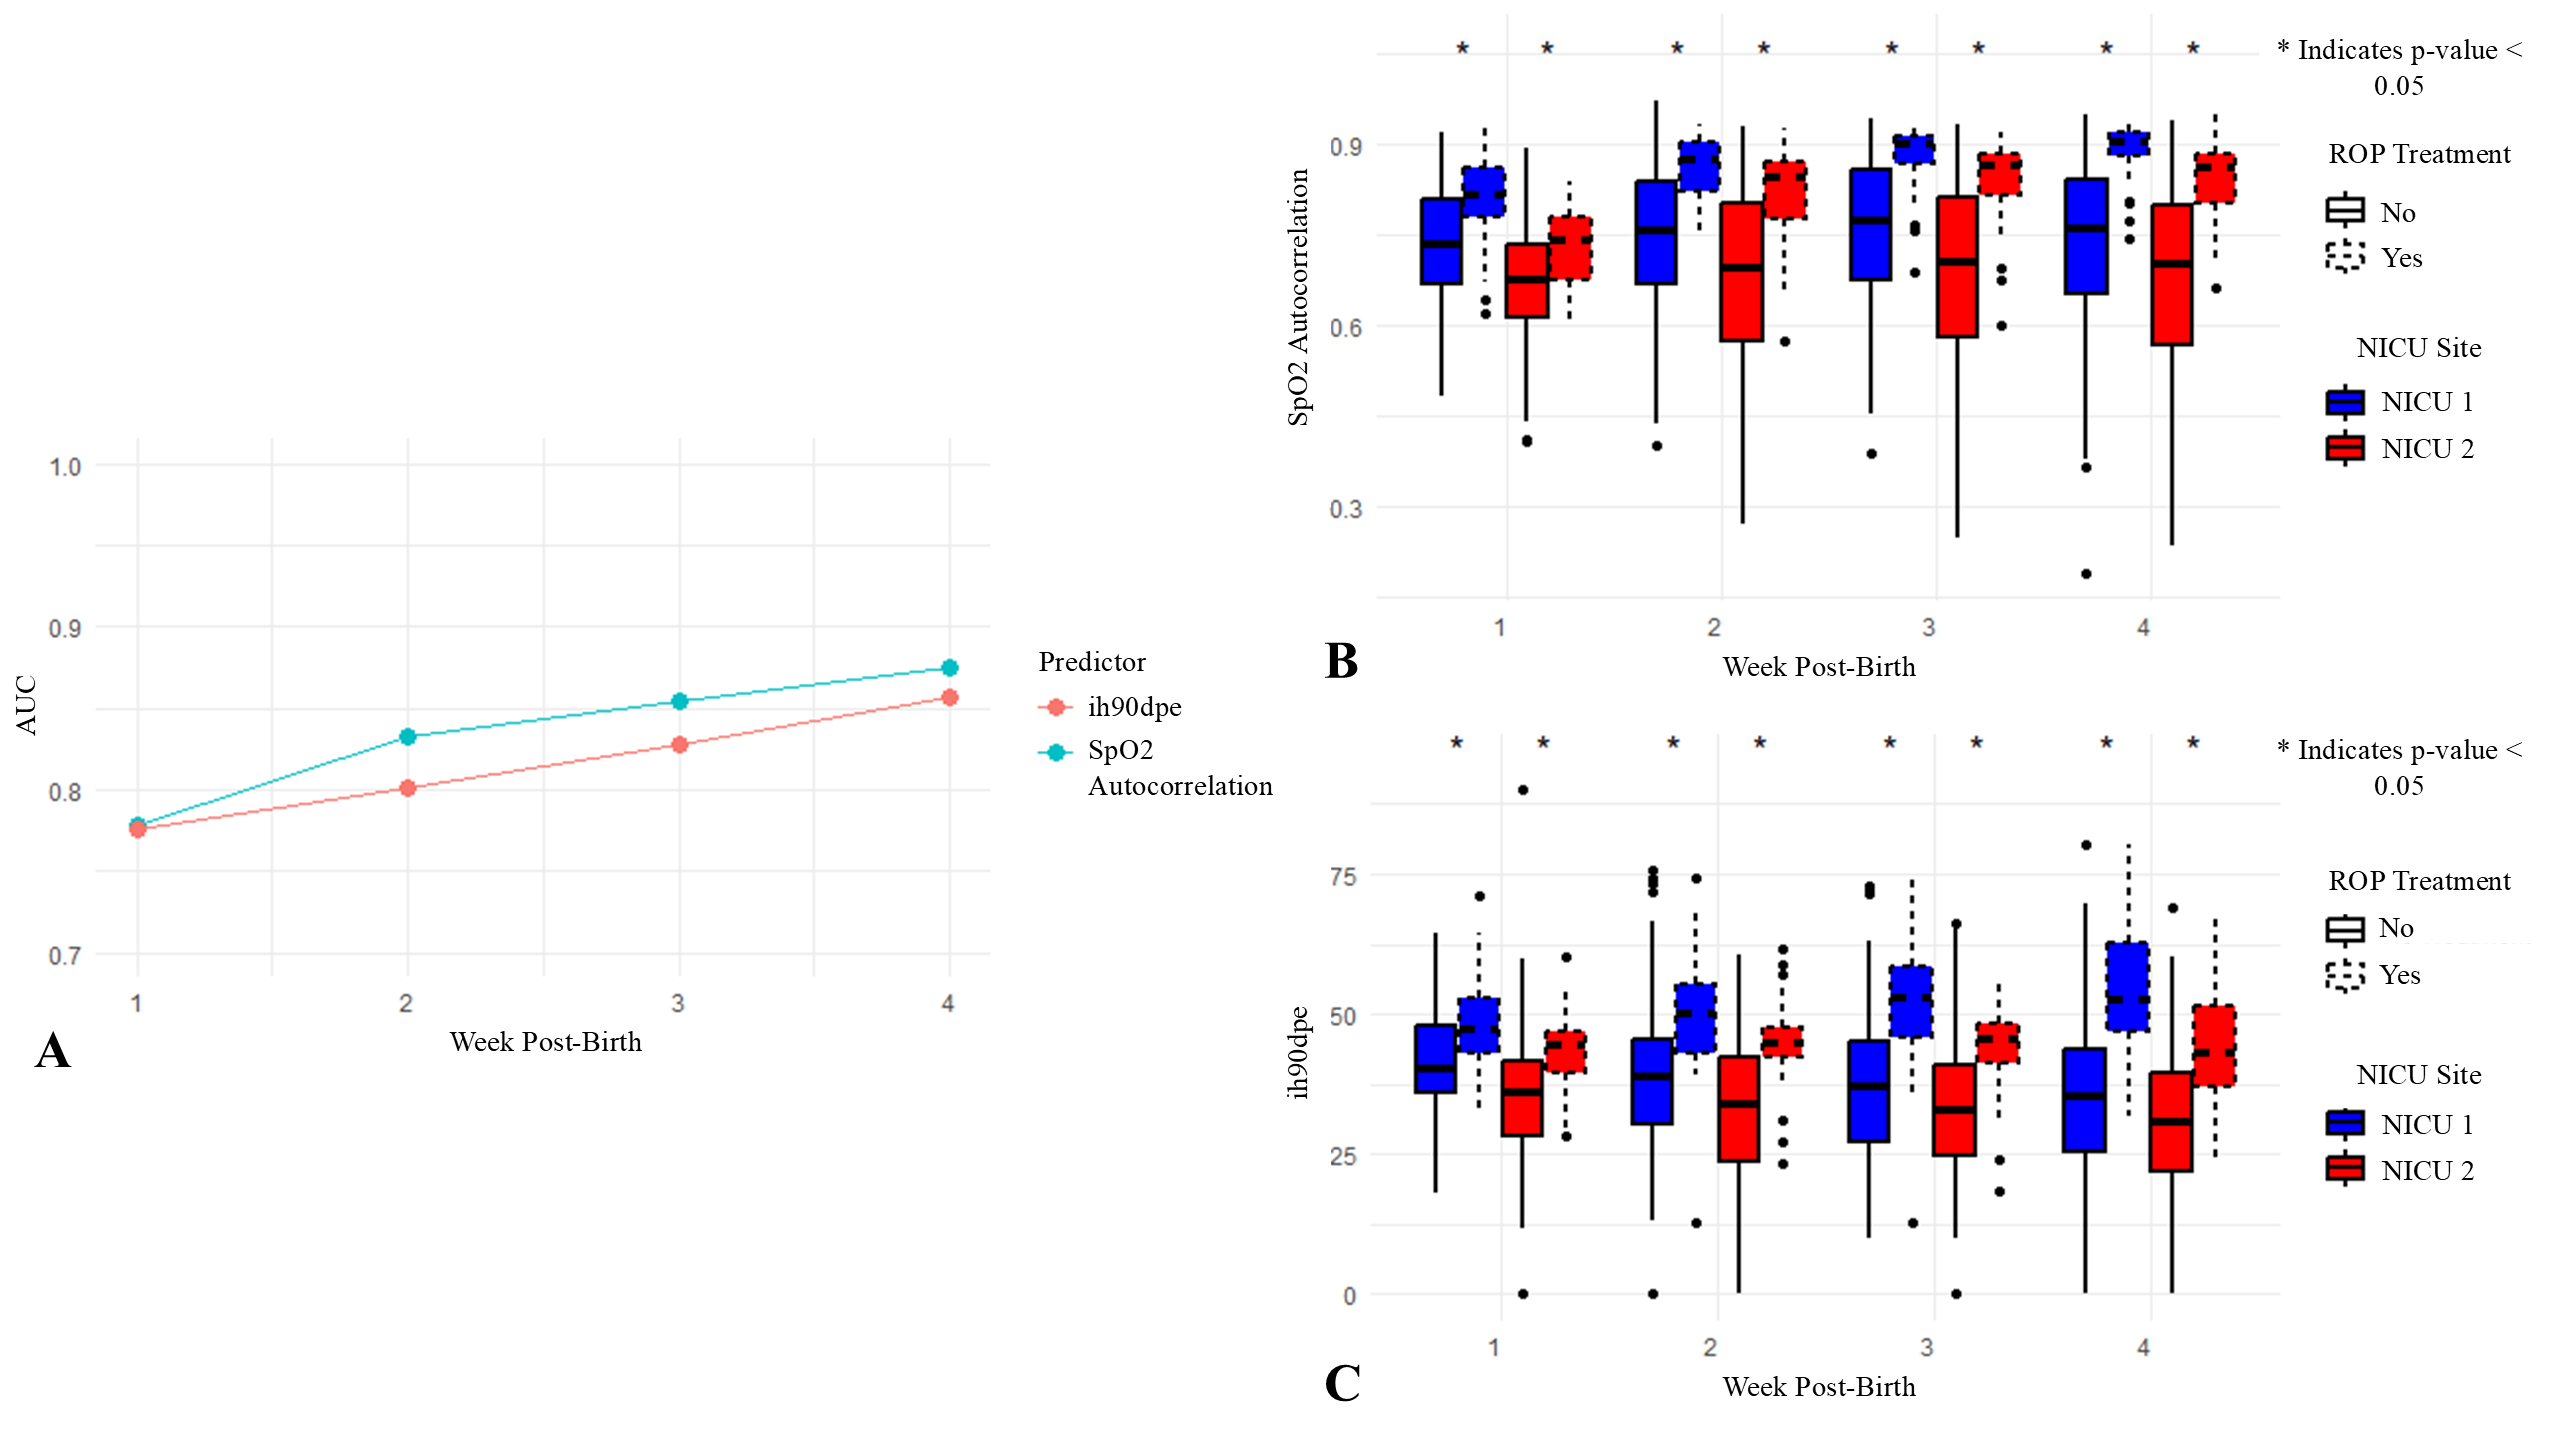
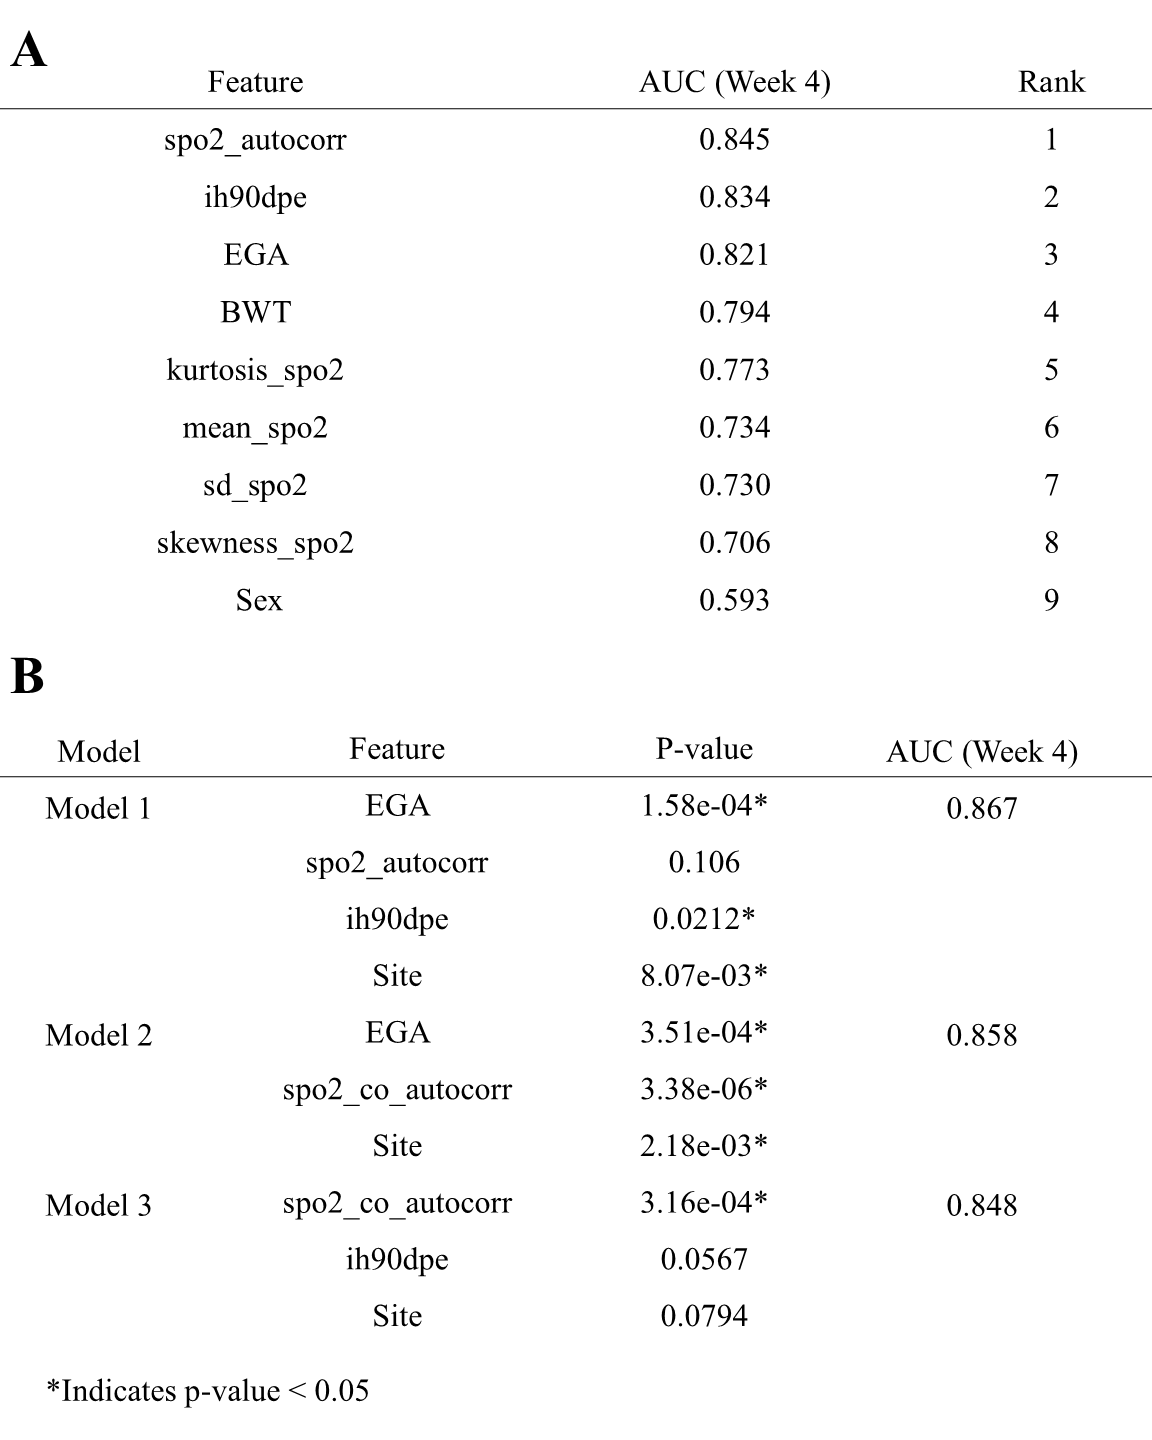
Results: We studied 504 neonates, of whom 68 (13%) had ROP requiring treatment (Table 1). Treatment was more common at NICU 1 than at NICU 2 (23% vs. 8%, p = 8.59e-07). SpO2 features changed over the first 4 weeks and differed by site, with the greatest differences in the fourth week (Figure 1). Gestational age alone predicted severe ROP with high AUC, but SpO2 features from week 4 improved predictive performance across sites (Table 2). High SpO2 autocorrelation (detecting sustained hypoxemia) and duration of IH events with SpO2 < 90% were the HCTSA features most strongly associated with treated ROP (Figure 1, Table 2).
Conclusion(s): Hypoxemia metrics calculated from SpO2 data using novel time series analytics add to prematurity for severe ROP risk prediction. Combined models performed well at NICUs with high and low rates of treated ROP.
Table 1
 Distribution of categorical and continuous demographic variables among ROP treatment groups.
Figure 1
 (A) AUC values for logistic regression models predicting treatment for ROP across weeks 1-4 post-birth. Two predictors, SpO2 autocorrelation and IH90DPE, were evaluated separately in the models. SpO2 autocorrelation measures the similarity of SpO2 values over time, with higher values indicating prolonged periods of similar SpO2 levels, which may correspond to sustained hypoxemia and greater respiratory instability. IH90DPE represents the cumulative duration per event that SpO2 levels are maintained below 90%. (B) and (C) Box plots display the SpO2 autocorrelation and IH90DPE values, respectively, for neonates across weeks 1-4 post-birth, separated by NICU site and ROP treatment group. Asterisks (*) above boxes indicate significant differences in autocorrelation or IH90DPE between treatment groups within each NICU site and week (p <0.05, Mann-Whitney U test).
Table 2: AUC Results for Individual and Combined Models Predicting ROP Treatment
 (A) AUC values for logistic regression models predicting ROP treatment based on individual predictors. Each model includes a single feature combined with site as a covariate. The AUC values were calculated using 10-fold cross-validation with predefined folds. (B) AUC values and corresponding p-values for logistic regression models incorporating combinations of predictors. Models were evaluated using fixed 10-fold cross-validation, with each predictor’s statistical significance indicated by p-values derived from model coefficients. Significant p-values (p <0.05) denote predictors that significantly contributed to the model’s accuracy within each cross-validated analysis.
Table 1
 Distribution of categorical and continuous demographic variables among ROP treatment groups.
Figure 1
 (A) AUC values for logistic regression models predicting treatment for ROP across weeks 1-4 post-birth. Two predictors, SpO2 autocorrelation and IH90DPE, were evaluated separately in the models. SpO2 autocorrelation measures the similarity of SpO2 values over time, with higher values indicating prolonged periods of similar SpO2 levels, which may correspond to sustained hypoxemia and greater respiratory instability. IH90DPE represents the cumulative duration per event that SpO2 levels are maintained below 90%. (B) and (C) Box plots display the SpO2 autocorrelation and IH90DPE values, respectively, for neonates across weeks 1-4 post-birth, separated by NICU site and ROP treatment group. Asterisks (*) above boxes indicate significant differences in autocorrelation or IH90DPE between treatment groups within each NICU site and week (p <0.05, Mann-Whitney U test).
Table 2: AUC Results for Individual and Combined Models Predicting ROP Treatment
 (A) AUC values for logistic regression models predicting ROP treatment based on individual predictors. Each model includes a single feature combined with site as a covariate. The AUC values were calculated using 10-fold cross-validation with predefined folds. (B) AUC values and corresponding p-values for logistic regression models incorporating combinations of predictors. Models were evaluated using fixed 10-fold cross-validation, with each predictor’s statistical significance indicated by p-values derived from model coefficients. Significant p-values (p <0.05) denote predictors that significantly contributed to the model’s accuracy within each cross-validated analysis.
